CSN Infographics
![]() This page displays all infographics created by the Children’s Safety Network (CSN) using Piktochart. Please feel free to download and share through Facebook, X, Pinterest, or email.
This page displays all infographics created by the Children’s Safety Network (CSN) using Piktochart. Please feel free to download and share through Facebook, X, Pinterest, or email.
Released Date:
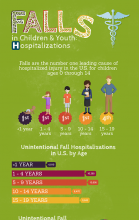
Falls are the number one leading cause of hospitalized injury in the U.S. for children ages 0 through 14. This infographic has information on the frequency and causes of fall hospitalizations among children and youth. Download a print version of the infographic Falls are the…
Released Date:
In 2013, US high school students took the CDC’s Youth Risk Behavior Survey. This infographic outlines some of the findings related to bullying and fighting. Download a printable PDF of the infographic How Common Are Bullying and Fighting among High Schoolers? In 2013, US high school students…
Released Date:
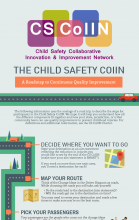
Child Safety CoIIN: A Roadmap to Continuous Quality Improvement The following information uses the analogy of a road trip to describe the steps for participants in the Child Safety CoIIN. We hope it will help you understand how all the different components fit together and how your state,…
Released Date:
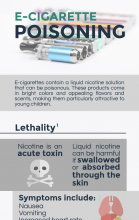
E-cigarettes contain a liquid nicotine solution that can be poisonous. These products come in bright colors and appealing flavors and scents, making them particularly attractive to young children. Print version of infographic with sources Poster version of infographic Lethality[1] Nicotine is an…
Released Date:
The deadliest day of the year for child pedestrians is Halloween. On average, over two times as many child pedestrians die on Halloween compared to other days. Our Halloween Safety infographic has safety facts and tips to make sure you and your children have a safe and happy Halloween! Print…
Released Date:
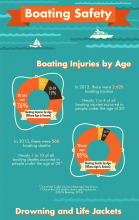
In 2013, 560 individuals lost their lives while boating, and 2,620 sustained non-fatal injuries. Forty-nine of those who died and 589 of those who were injured were youth between the ages of 0 and 19 years old. Since 1971, boating deaths have steadily decreased thanks to programs focusing on boater…
Released Date:
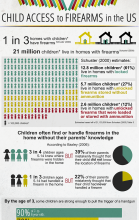
Children often find or handle firearms in the home without their parents' knowledge. In the United States, 2,600,000 children live in homes with unlocked firearms that are stored loaded or with ammunition. Child Access to Firearms in the US discusses the number of children who have firearms in…
Released Date:
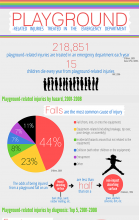
218,851 playground-related injuries are treated in an emergency department each year. This infographic breaks down playground-related injuries by hazard, diagnosis, equipment, and age and sex. Additional resources on playground safety can be found in the text below. Click here for the print…
Released Date:
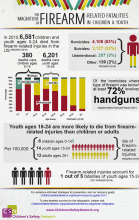
In 2010, 6,581 children and youth ages 0-24 died from firearm-related injuries in the US. The Magnitude of Firearm-Related Fatalities in Children and Youth breaks down the firearm-related fatalities of children and youth by age and intent. This is the second infographic in a three-part series…
Released Date:
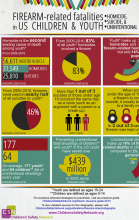
This infographic covers three types of firearm-related injuries and how they affect children and youth: homicide, suicide, and unintentional. This is the first in a three-part series of infographics about firearms. The other infographics in the series are available here: The Magnitude of…
Released Date:
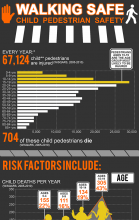
WALKING SAFE: Child Pedestrian Safety Every year:* 67,124 child** pedestrians are fatally or nonfatally injured(WISQARS, 2005-2010) Children ages 15-19 suffer the most pedestrian injures (WISQARS, 2005-2010) Age Group Average Fatal and Nonfatal Injuries per Year 0-4 yrs 6,456 5-9 yrs 12,…
Released Date:
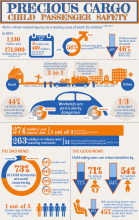
Though child passenger fatalities have decreased, motor vehicle-related injuries are still a leading cause of death for children. Proper use of child restraints can significantly reduce the risk of injury and death for children. Unfortunately, many child restraints are used incorrectly. This…
Released Date:
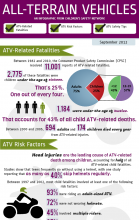
CSN released this infographic on all-terrain vehicles (ATVs), which includes information on ATV-related fatalities, ATV risk factors, and ATV safety tips. Print version of ATV Infographic