CSN Publications by Topic
![]() This page displays all Children’s Safety Network (CSN) publications sorted by Topic. Please feel free to download and share through Facebook, X, Pinterest, or email.
This page displays all Children’s Safety Network (CSN) publications sorted by Topic. Please feel free to download and share through Facebook, X, Pinterest, or email.
Injuries and violence are among the most serious social, economic, medical, and public health issues. Injuries and violence are a leading killer among all ages, and the number one killer among kids, teens, and adults ages 1-44.1 Injuries and violence affect all of us including the families left…
About CSN
This overview summarizes the work of the Children's Safety Network.
This document outlines how CSN can assist state MCH and IVP programs.
Bike Safety
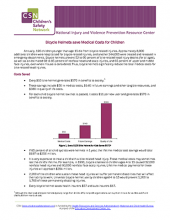
This publication discusses the monetary importance of wearing a helmet, focusing on how much helmets decrease medical and insurance costs.
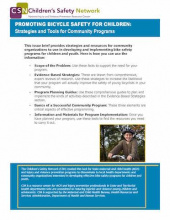
This tool was created for State Maternal & Child Health (MCH) and injury prevention programs to disseminate to local health departments and community organizations interested in developing effective bike safety programs for children and youth.
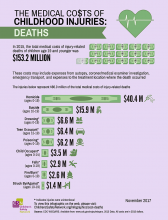
In 2015, the total medical costs of injury-related deaths of children age 19 and younger was $153.2 million. This infographic breaks out the medical cost of child deaths by injury topic. Download a PDF of the infographic for printing This is part of a series on the costs of childhood injuries…
Bullying Prevention
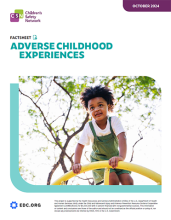
Childhood lays the foundation for future success, with safe and supportive environments promoting healthier adult outcomes. Adverse Childhood Experiences (ACEs) can lead to long-term social, behavioral, and health challenges. Preventing and addressing ACEs is vital, and requires family, community,…

Assessing Prevention Capacity & Implementing Change: A Bullying Prevention Capacity Assessment and Change Package | HRSA

This resource was recently updated. Visit the latest version. In the 2013 Youth Risk Behavior Survey (YRBS), 20 percent of students reported being bullied on school property and 15 percent reported being electronically bullied in the 12 months preceding the survey. Victimized youth are at…
Bullying during childhood and adolescence is painful when it happens and can have long lasting effects, both for the bully and the victim. Despite efforts to decrease bullying, the percentage of students reporting being bullied- roughly one in five- has not changed since bullying-related data began…
The U.S. Department of Health and Human Services defines bullying as repetitive aggressive behavior that is repeated over time and involves an imbalance of power or strength (Centers for Disease Control and Prevention [CDC], 2017a). Bullying behaviors may include teasing, name calling, mockery…
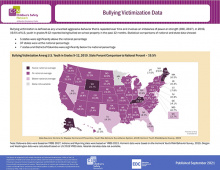
The Child Safety Learning Collaborative addresses the leading causes of child and adolescent injuries, fatalities and hospitalizations for youth ages 0-19. This data map provides statistical comparisons of national and state rates for Bullying Victimization. Download the PDF of the Publication
The Child Safety Learning Collaborative addresses the leading causes of child and adolescent injuries, fatalities and hospitalizations for youth ages 0-19. This data map provides statistical comparisons of national and state rates for bullying victimization. For data maps covering earlier years (e.…
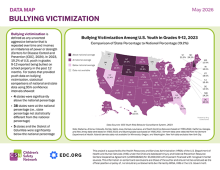
The Child Safety Learning Collaborative addresses the leading causes of child and adolescent injuries, fatalities and hospitalizations for youth ages 0-19. This data map provides statistical comparisons of national and state rates for Bullying Victimization (2023), Sudden Unexpected Infant…
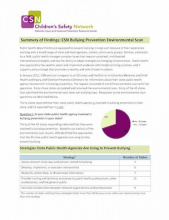
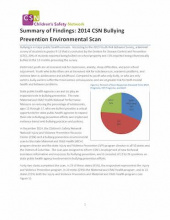
In January 2011, CSN sent out a request to all 50 states and the District of Columbia Maternal and Child Health and Injury and Violence Prevention Directors for information about their state public health agency involvement in bullying prevention. The request consisted of a brief environmental scan…

With back-to-school around the corner, CSN is providing this special issue of our newsletter on preventing injuries at school. This newsletter issue contains information on organizations working to create safe environments in schools, data and research on youth risk behavior, school crime data, and…
In 2013, US high school students took the CDC’s Youth Risk Behavior Survey. This infographic outlines some of the findings related to bullying and fighting. Download a printable PDF of the infographic How Common Are Bullying and Fighting among High Schoolers? In 2013, US high school students…

Youth who identify as lesbian, gay, bisexual, questioning, or other non-heterosexual identity (LGBQ+) are resilient1 and diverse, representing every racial, ethnic, and socioeconomic group and are present in every community across the U.S.2 They make up 24% of the high-school aged population.3…
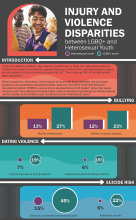
Youth who identify as lesbian, gay, bisexual, questioning, or other non-heterosexual identity (LGBQ+) are resilient1 and diverse, representing every racial, ethnic, and socioeconomic group and are present in every community across the U.S.2 They make up 24% of the high-school aged population.3…
Youth who identify as lesbian, gay, bisexual, questioning, or other non-heterosexual identity (LGBQ+) are resilient1 and diverse, representing every racial, ethnic, and socioeconomic group and are present in every community across the U.S.2 They make up 24% of the high-school aged population.3…
According to the 2013 Youth Risk Behavior Survey (YRBS), nearly 15 percent of high school students have experienced electronic bullying within the past year. Sexting has become a concern as adolescents text, e-mail, or post explicit pictures of themselves or others on social networking sites.…
This resource was recently updated. Visit the latest version. This article discusses the prevalence and consequences of bullying on both the victims and bullies themselves and focuses on the role that public health officials play in preventing bullying.
Bullying is a major public health concern. According to the 2013 Youth Risk Behavior Survey, a biennial survey of students in grades 9-12 that is conducted by the Centers for Disease Control and Prevention (CDC), 20% of students reported being bullied on school property and 15% reported being…
Child Care Safety
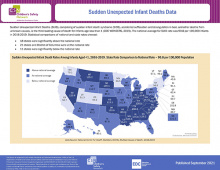
The Child Safety Learning Collaborative addresses the leading causes of child and adolescent injuries, fatalities and hospitalizations for youth ages 0-19. This data map provides statistical comparisons of national and state rates for Sudden Unexpected Infant Deaths.Download the PDF of the…
Toy Injuries in U.S. Children: Know the Facts Between 2015 and 2018, U.S. children and adolescents ages 0-19 sustained over 1 million toy-related injuries that were treated in emergency departments. Common injury diagnoses related to toy injuries are laceration, contusion/abrasion, fracture,…
Child Maltreatment Prevention
Childhood lays the foundation for future success, with safe and supportive environments promoting healthier adult outcomes. Adverse Childhood Experiences (ACEs) can lead to long-term social, behavioral, and health challenges. Preventing and addressing ACEs is vital, and requires family, community,…
Child maltreatment (including sexual, physical and emotional abuse) and neglect are serious public health problems which can be prevented. These adverse childhood experiences, resulting in harm, the potential for harm, or threat of harm among children under the age of 18 can be perpetrated by a…
This fact sheet covers the costs of childhood injuries, including medical costs, work loss costs, and quality of life loss costs. Work loss costs include lost wages of injured persons and lost household work, or, in the case of fatality, lost earnings and household work over the victim’s…
This publication lists evidence-based strategies and readings on child passenger safety, falls prevention, interpersonal violence prevention, suicide and self-harm prevention, and teen driver safety.
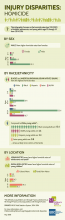
This infographic focuses on the homicide rates (per 100,000) of children, adolescents, and young adults ages 0 through 24 from 2014-2016. It breaks out these homicides by sex, race/ethnicity, and location. Download a PDF of the infographic for printing This is part of a series on injury…
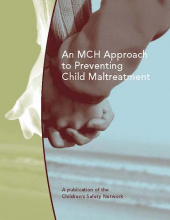
This report provides State MCH professionals with information about child maltreatment and how they can help prevent the abuse and neglect of children. It includes four sections: summary of the extent, causes, and consequences of child maltreatment; describes why and how MCH programs can contribute…
In 2015, the total medical costs of injury-related deaths of children age 19 and younger was $153.2 million. This infographic breaks out the medical cost of child deaths by injury topic. Download a PDF of the infographic for printing This is part of a series on the costs of childhood injuries…
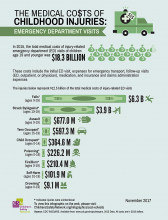
In 2015, the total medical costs of injury-related emergency department (ED) visits of children age 19 and younger was $18.3 billion. This infographic breaks out the medical cost of emergency department visits of children by injury topic. Download a PDF of the infographic for printing This is part…
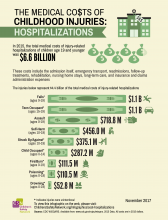
In 2015, the total medical costs of injury-related hospitalizations of children age 19 and younger was $6.6 billion. This infographic breaks out the medical cost of hospitalizations of children by injury topic. Download a PDF of the infographic for printing This is part of a series on the costs of…
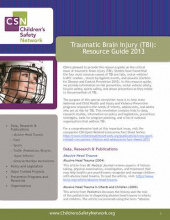
This resource was recently updated. Visit the latest version. CSN is pleased to provide this resource guide on the critical issue of traumatic brain injury (TBI). Studies have found that the four most common causes of TBI are falls, motor vehicle/traffic crashes, struck by/against events,…
Child Passenger Safety
This fact sheet summarizes a study of total cost savings of child safety seats. It also outlines incentives for involving insurers in the distribution of child safety seats

Change Packages The Change Packages list the evidence-based and evidence-informed strategies that will lead to breakthrough improvement in key topic areas of child safety. The change packages are available as comprehensive resources organized across the entire socio-ecological model, and also…
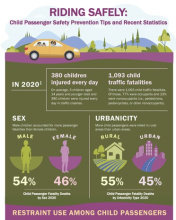
Motor vehicle crashes are a leading cause of death among children ages one through 14 (CDC, 2016). In 2013, an average of three children were killed and 470 were injured every day in motor vehicle crashes in the U.S. (NHTSA, 2015). Child passenger safety requires consistent use of…
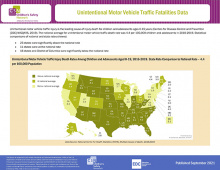
The Child Safety Learning Collaborative addresses the leading causes of child and adolescent injuries, fatalities and hospitalizations for youth ages 0-19. This data map provides statistical comparisons of national and state rates for Unintentional Motor Vehicle Traffic Fatalities.Download the PDF…
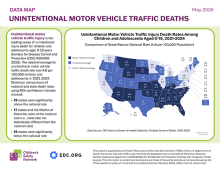
The Child Safety Learning Collaborative addresses the leading causes of child and adolescent injuries, fatalities and hospitalizations for youth ages 0-19. This data map provides statistical comparisons of national and state rates for unintentional motor vehicle traffic fatalities. For data…
The Child Safety Learning Collaborative addresses the leading causes of child and adolescent injuries, fatalities and hospitalizations for youth ages 0-19. This data map provides statistical comparisons of national and state rates for Bullying Victimization (2023), Sudden Unexpected Infant…
This fact sheet covers the costs of childhood injuries, including medical costs, work loss costs, and quality of life loss costs. Work loss costs include lost wages of injured persons and lost household work, or, in the case of fatality, lost earnings and household work over the victim’s…
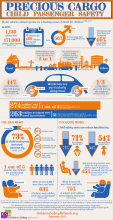
This CSN infographic focuses on the disparities in child passenger deaths and offers prevention strategies. Download a print version of the infographic Disparities in Child Passenger Safety Motor vehicle crashes are a leading cause of death among children[*] From 2010 through 2014, an average of…
This publication lists evidence-based strategies and readings on child passenger safety, falls prevention, interpersonal violence prevention, suicide and self-harm prevention, and teen driver safety.
This resource was recently updated. Visit the latest version. Summarizes the incidence and cost savings of interventions to prevent injuries due to motor vehicles, impaired driving, open-flame/burns, and violence. Also includes cost savings realized by health/miscellaneous services and…
Though child passenger fatalities have decreased, motor vehicle-related injuries are still a leading cause of death for children. Proper use of child restraints can significantly reduce the risk of injury and death for children. Unfortunately, many child restraints are used incorrectly. This…
In 2015, the total medical costs of injury-related deaths of children age 19 and younger was $153.2 million. This infographic breaks out the medical cost of child deaths by injury topic. Download a PDF of the infographic for printing This is part of a series on the costs of childhood injuries…
In 2015, the total medical costs of injury-related emergency department (ED) visits of children age 19 and younger was $18.3 billion. This infographic breaks out the medical cost of emergency department visits of children by injury topic. Download a PDF of the infographic for printing This is part…
In 2015, the total medical costs of injury-related hospitalizations of children age 19 and younger was $6.6 billion. This infographic breaks out the medical cost of hospitalizations of children by injury topic. Download a PDF of the infographic for printing This is part of a series on the costs of…
This resource was recently updated. Visit the latest version. CSN is pleased to provide this resource guide on the critical issue of traumatic brain injury (TBI). Studies have found that the four most common causes of TBI are falls, motor vehicle/traffic crashes, struck by/against events,…
Choking & Strangulation Prevention
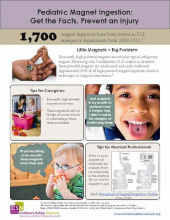
Powerful, rare earth (neodymium) magnets can cause serious injury and death when ingested. The CPSC (Consumer Product Safety Commission) has reported an estimated 1,700 ingestions of magnets that were treated in emergency departments between Jan. 1, 2009 and Dec. 31, 2011. These injuries are…
Cross Cutting Prevention Strategies

The Children’s Safety Network Framework for Quality Improvement and Innovation in Child Safety (CSN Framework) integrates child safety expertise, leadership and management, and systems improvement methods to strengthen child safety systems and workforce capacity, aiming to improve child and…
Delivering interventions that have been shown to be effective in improving desired outcomes—also referred to as evidence-based practices (EBPs)—is critical to achieving improvements in child safety. Ideally, the interventions selected are ones that best fit local needs and circumstances. But even…
Assessing Prevention Capacity & Implementing Change: A Bullying Prevention Capacity Assessment and Change Package | HRSA
Change Packages The Change Packages list the evidence-based and evidence-informed strategies that will lead to breakthrough improvement in key topic areas of child safety. The change packages are available as comprehensive resources organized across the entire socio-ecological model, and also…
A new resource guide from the Children’s Safety Now Alliance is available to help public health professionals find and use national data on child and adolescent injuries and violence. The guide covers 12 national data systems, explaining what each one captures, its strengths and limitations,…
Title V agencies working in injury and violence prevention and child safety address a broad range of injury topics across many populations. Partnering with national level public health agencies, organizations, and networks can play an important role in increasing the reach and impact of child…
This fact sheet covers the costs of childhood injuries, including medical costs, work loss costs, and quality of life loss costs. Work loss costs include lost wages of injured persons and lost household work, or, in the case of fatality, lost earnings and household work over the victim’s…
When a disaster, disease outbreak, or other crisis occurs, overwhelming a community’s capacity to respond, child safety efforts often need to adapt in order to be sustained. These disruptions can increase the risk for child injury and illness, while also creating serious challenges for…
Injuries and violence are leading causes of morbidity and mortality among U.S. children and adolescents. These injuries are preventable. Researchers have identified many strategies that are effective in preventing injuries in this population. This paper synthesizes findings from recent systematic…
With back-to-school around the corner, CSN is providing this special issue of our newsletter on preventing injuries at school. This newsletter issue contains information on organizations working to create safe environments in schools, data and research on youth risk behavior, school crime data, and…
Injuries and violence are leading causes of morbidity and mortality among U.S. children and adolescents. These injuries are preventable. The Children's Safety Now Alliance developed a resource guide, "CSN Framework for Quality Improvement and Innovation in Child Safety: A Guide to Implementing…
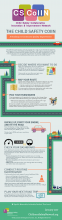
Child Safety CoIIN: A Roadmap to Continuous Quality Improvement The following information uses the analogy of a road trip to describe the steps for participants in the Child Safety CoIIN. We hope it will help you understand how all the different components fit together and how your state,…
The injury and violence prevention systems toolkit is a compilation of resources aimed at state and jurisdiction public health practitioners and organizational leaders and managers committed to reducing injuries and violence through systems thinking and quality improvement. The toolkit is organized…
According to the 2013 Youth Risk Behavior Survey (YRBS), nearly 15 percent of high school students have experienced electronic bullying within the past year. Sexting has become a concern as adolescents text, e-mail, or post explicit pictures of themselves or others on social networking sites.…
Injuries are the leading causes of morbidity and mortality among U.S. children and adolescents. State injury and violence prevention programs address a broad range of injury topics across varying populations, with initiatives funded by multiple sources, including federal agencies, hospitals,…
Participants in the Child Safety Collaborative Innovation and Improvement Network (CS CoIIN) are identifying and developing innovative ways to collect real-time outcomes data. Typically, data on injury-related deaths, hospitalizations, and emergency department (ED) visits are centrally collected at…
In 2015, the total medical costs of injury-related deaths of children age 19 and younger was $153.2 million. This infographic breaks out the medical cost of child deaths by injury topic. Download a PDF of the infographic for printing This is part of a series on the costs of childhood injuries…
In 2015, the total medical costs of injury-related emergency department (ED) visits of children age 19 and younger was $18.3 billion. This infographic breaks out the medical cost of emergency department visits of children by injury topic. Download a PDF of the infographic for printing This is part…
Drowning Prevention
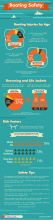
In 2013, 560 individuals lost their lives while boating, and 2,620 sustained non-fatal injuries. Forty-nine of those who died and 589 of those who were injured were youth between the ages of 0 and 19 years old. Since 1971, boating deaths have steadily decreased thanks to programs focusing on boater…
This fact sheet covers the costs of childhood injuries, including medical costs, work loss costs, and quality of life loss costs. Work loss costs include lost wages of injured persons and lost household work, or, in the case of fatality, lost earnings and household work over the victim’s…
Numbers Drowning is the leading cause of unintentional injury deaths for children ages 1-4. For children and adolescents ages 5-19, drowning is the third leading cause of unintentional injury deaths. Every year in the U.S., approximately 3,700 people die from unintentional drowning. Nearly 900 of…
Every year in the US, 3,572 people die from drowning. Nine hundred and forty-five of them are children. Children account for one out of four drowning deaths. This infographic from the Children's Safety Network covers the demographics of drownings, locations of drownings, near drowning, and…
In 2015, the total medical costs of injury-related deaths of children age 19 and younger was $153.2 million. This infographic breaks out the medical cost of child deaths by injury topic. Download a PDF of the infographic for printing This is part of a series on the costs of childhood injuries…
In 2015, the total medical costs of injury-related emergency department (ED) visits of children age 19 and younger was $18.3 billion. This infographic breaks out the medical cost of emergency department visits of children by injury topic. Download a PDF of the infographic for printing This is part…
In 2015, the total medical costs of injury-related hospitalizations of children age 19 and younger was $6.6 billion. This infographic breaks out the medical cost of hospitalizations of children by injury topic. Download a PDF of the infographic for printing This is part of a series on the costs of…
Falls Prevention
Change Packages The Change Packages list the evidence-based and evidence-informed strategies that will lead to breakthrough improvement in key topic areas of child safety. The change packages are available as comprehensive resources organized across the entire socio-ecological model, and also…
This fact sheet covers the costs of childhood injuries, including medical costs, work loss costs, and quality of life loss costs. Work loss costs include lost wages of injured persons and lost household work, or, in the case of fatality, lost earnings and household work over the victim’s…
This publication lists evidence-based strategies and readings on child passenger safety, falls prevention, interpersonal violence prevention, suicide and self-harm prevention, and teen driver safety.
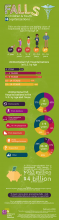
Falls are the number one leading cause of hospitalized injury in the U.S. for children ages 0 through 14. This infographic has information on the frequency and causes of fall hospitalizations among children and youth. Download a print version of the infographic Falls are the…
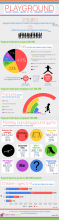
218,851 playground-related injuries are treated in an emergency department each year. This infographic breaks down playground-related injuries by hazard, diagnosis, equipment, and age and sex. Additional resources on playground safety can be found in the text below. Click here for the print…
In 2015, the total medical costs of injury-related deaths of children age 19 and younger was $153.2 million. This infographic breaks out the medical cost of child deaths by injury topic. Download a PDF of the infographic for printing This is part of a series on the costs of childhood injuries…
In 2015, the total medical costs of injury-related emergency department (ED) visits of children age 19 and younger was $18.3 billion. This infographic breaks out the medical cost of emergency department visits of children by injury topic. Download a PDF of the infographic for printing This is part…
In 2015, the total medical costs of injury-related hospitalizations of children age 19 and younger was $6.6 billion. This infographic breaks out the medical cost of hospitalizations of children by injury topic. Download a PDF of the infographic for printing This is part of a series on the costs of…
Toy Injuries in U.S. Children: Know the Facts Between 2015 and 2018, U.S. children and adolescents ages 0-19 sustained over 1 million toy-related injuries that were treated in emergency departments. Common injury diagnoses related to toy injuries are laceration, contusion/abrasion, fracture,…
This resource was recently updated. Visit the latest version. CSN is pleased to provide this resource guide on the critical issue of traumatic brain injury (TBI). Studies have found that the four most common causes of TBI are falls, motor vehicle/traffic crashes, struck by/against events,…
Fire & Burn Safety
This fact sheet covers the costs of childhood injuries, including medical costs, work loss costs, and quality of life loss costs. Work loss costs include lost wages of injured persons and lost household work, or, in the case of fatality, lost earnings and household work over the victim’s…
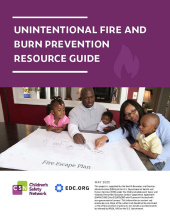
This resource was recently updated. Visit the latest version. In 2013, fires and burns were the fourth leading cause of injury-related deaths to children ages 1-18 in the U.S. (WISQARS). Most of these deaths were caused by residential fires, although a working smoke detector can…
This resource was recently updated. Visit the latest version. Summarizes the incidence and cost savings of interventions to prevent injuries due to motor vehicles, impaired driving, open-flame/burns, and violence. Also includes cost savings realized by health/miscellaneous services and…
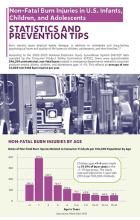
Burn injuries cause physical bodily damage, in addition to immediate and long-lasting psychological harm and quality of life losses to children, adolescents, and their families.1-3 According to the 2020-2023 National Electronic Injury Surveillance System (NEISS)4 data operated by the Consumer…
In 2015, the total medical costs of injury-related deaths of children age 19 and younger was $153.2 million. This infographic breaks out the medical cost of child deaths by injury topic. Download a PDF of the infographic for printing This is part of a series on the costs of childhood injuries…
In 2015, the total medical costs of injury-related emergency department (ED) visits of children age 19 and younger was $18.3 billion. This infographic breaks out the medical cost of emergency department visits of children by injury topic. Download a PDF of the infographic for printing This is part…
In 2015, the total medical costs of injury-related hospitalizations of children age 19 and younger was $6.6 billion. This infographic breaks out the medical cost of hospitalizations of children by injury topic. Download a PDF of the infographic for printing This is part of a series on the costs of…
Fires and burns are the fifth leading cause of unintentional injury-related deaths to infants, children, and adolescents ages <1-19 in the U.S.1 Nearly 300 U.S. infants, children, and adolescents die2 and about 80,000 are treated and released from emergency departments (ED) per year for nonfatal…
Firearm Safety
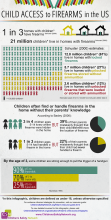
Children often find or handle firearms in the home without their parents' knowledge. In the United States, 2,600,000 children live in homes with unlocked firearms that are stored loaded or with ammunition. Child Access to Firearms in the US discusses the number of children who have firearms in…

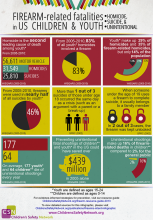
On average, over 3,000 U.S. children and adolescents die each year from a firearm injury. Approximately nine children and adolescents ages 0 to 19 die by firearm injury each day in the United States, with about five of those deaths being homicide-related and three being suicide-related. In the…

A firearm injury is a gunshot wound or penetrating injury from a weapon that uses a powder charge to fire a projectile, such as a handgun, rifle, or shotgun. Injuries from air- and gas-powered guns, BB guns, and pellet guns are not considered firearm injuries as these weapons do not use a powder…
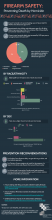
FIREARM SAFETY: Preventing Death by Homicide Firearm homicide is the second leading cause of injury death for children and adolescents ages 0-19. * Approximately nine children and adolescents ages 0 to 19 die by firearm injury each day in the U.S., and about five of those deaths are homicide…
FIREARM SAFETY: Preventing Death by Suicide Firearm suicides are the fourth leading cause of injury death for children ages (10-19).* Approximately nine children and adolescents ages 10 to 19 die by firearm injury each day in the U.S., and about three of those deaths are suicide-related…
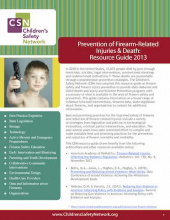
This resource was recently updated. Visit the latest version. The Children’s Safety Network (CSN) has compiled this resource guide on Firearm Safety and Firearm Violence Prevention to provide state Maternal and Child Health and Injury and Violence Prevention programs with a summary of what…
This infographic covers three types of firearm-related injuries and how they affect children and youth: homicide, suicide, and unintentional. This is the first in a three-part series of infographics about firearms. The other infographics in the series are available here: The Magnitude of…
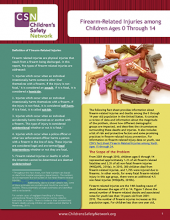
The following fact sheet provides information about firearm-related injuries and deaths among the 0 through 14 year old population in the United States. It contains a review of data and information about the magnitude of the problem, shows how different demographic groups…
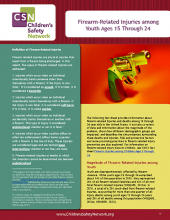
The following fact sheet provides information about firearm-related injuries and deaths among 15 through 24 year olds in the United States. It contains a review of data and information about the magnitude of the problem, shows how different demographic groups are impacted,…
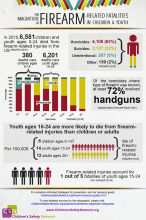
In 2010, 6,581 children and youth ages 0-24 died from firearm-related injuries in the US. The Magnitude of Firearm-Related Fatalities in Children and Youth breaks down the firearm-related fatalities of children and youth by age and intent. This is the second infographic in a three-part series…
Firearm injuries cost $174 billion in the United States in 2010 and the government's firearm injury bill alone exceeded $12 billion. PIRE researcher Ted Miller estimates annual firearm injury costs average $645 per gun in America. The costs include medical and mental health care costs,…
Health Disparities
Childhood lays the foundation for future success, with safe and supportive environments promoting healthier adult outcomes. Adverse Childhood Experiences (ACEs) can lead to long-term social, behavioral, and health challenges. Preventing and addressing ACEs is vital, and requires family, community,…
All Children are Pedestrians! Prevention Tips and Recent Statistics Approximately 600 children and adolescents die from pedestrian injuries each year. More than 3 in 4 pedestrian injuries in children and adolescents are related to motor vehicle traffic. Age Compared to children ages 5-9 or 10-14…
The U.S. Department of Health and Human Services defines bullying as repetitive aggressive behavior that is repeated over time and involves an imbalance of power or strength (Centers for Disease Control and Prevention [CDC], 2017a). Bullying behaviors may include teasing, name calling, mockery…
This CSN infographic focuses on the disparities in child passenger deaths and offers prevention strategies. Download a print version of the infographic Disparities in Child Passenger Safety Motor vehicle crashes are a leading cause of death among children[*] From 2010 through 2014, an average of…
Numbers Drowning is the leading cause of unintentional injury deaths for children ages 1-4. For children and adolescents ages 5-19, drowning is the third leading cause of unintentional injury deaths. Every year in the U.S., approximately 3,700 people die from unintentional drowning. Nearly 900 of…
FIREARM SAFETY: Preventing Death by Homicide Firearm homicide is the second leading cause of injury death for children and adolescents ages 0-19. * Approximately nine children and adolescents ages 0 to 19 die by firearm injury each day in the U.S., and about five of those deaths are homicide…
FIREARM SAFETY: Preventing Death by Suicide Firearm suicides are the fourth leading cause of injury death for children ages (10-19).* Approximately nine children and adolescents ages 10 to 19 die by firearm injury each day in the U.S., and about three of those deaths are suicide-related…
The following fact sheet provides information about firearm-related injuries and deaths among 15 through 24 year olds in the United States. It contains a review of data and information about the magnitude of the problem, shows how different demographic groups are impacted,…
In 2013, US high school students took the CDC’s Youth Risk Behavior Survey. This infographic outlines some of the findings related to bullying and fighting. Download a printable PDF of the infographic How Common Are Bullying and Fighting among High Schoolers? In 2013, US high school students…
Youth who identify as lesbian, gay, bisexual, questioning, or other non-heterosexual identity (LGBQ+) are resilient1 and diverse, representing every racial, ethnic, and socioeconomic group and are present in every community across the U.S.2 They make up 24% of the high-school aged population.3…
Youth who identify as lesbian, gay, bisexual, questioning, or other non-heterosexual identity (LGBQ+) are resilient1 and diverse, representing every racial, ethnic, and socioeconomic group and are present in every community across the U.S.2 They make up 24% of the high-school aged population.3…
Youth who identify as lesbian, gay, bisexual, questioning, or other non-heterosexual identity (LGBQ+) are resilient1 and diverse, representing every racial, ethnic, and socioeconomic group and are present in every community across the U.S.2 They make up 24% of the high-school aged population.3…
This infographic focuses on the rates (per 100,000) of drug poisoning deaths of adolescents and young adults ages 10-24 from 2014-2016. It breaks out these deaths by sex, race/ethnicity, and location. Drug poisoning is defined as an improper use of illicit drugs or medicine that is either…
This infographic focuses on the homicide rates (per 100,000) of children, adolescents, and young adults ages 0 through 24 from 2014-2016. It breaks out these homicides by sex, race/ethnicity, and location. Download a PDF of the infographic for printing This is part of a series on injury…
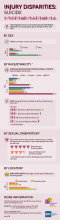
This infographic focuses on the suicide rates (per 100,000) of adolescents and young adults ages 10 through 24 from 2014-2016. It breaks out these deaths by sex, race/ethnicity, sexual orientation, and location. Download a PDF of the infographic for printing This is part of a series on injury…
The Planner is for use at the departmental and/or programmatic/work unit level to assess integration of integrative approaches in child safety initiatives. The Planner may be used as a stand-alone tool or with the CSN Framework for Quality Improvement and Innovation in Child Safety: A Guide to…
218,851 playground-related injuries are treated in an emergency department each year. This infographic breaks down playground-related injuries by hazard, diagnosis, equipment, and age and sex. Additional resources on playground safety can be found in the text below. Click here for the print…
Though child passenger fatalities have decreased, motor vehicle-related injuries are still a leading cause of death for children. Proper use of child restraints can significantly reduce the risk of injury and death for children. Unfortunately, many child restraints are used incorrectly. This…
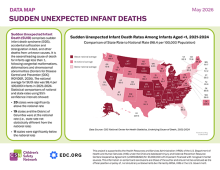
Sudden Unexpected Infant Death (SUID) refers to the sudden and unexpected death of an infant younger than one year of age. This infographic goes over the definition of SUID, the racial/ethnic differences in SUID rates, risk factors for SUID and provides resources on reducing SUID and…
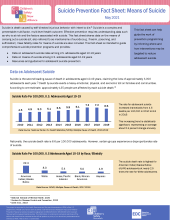
Suicide is a complex and preventable multi-factor, multi-level health outcome. Effective prevention requires understanding data such as who is at risk and the factors associated with suicide. This fact sheet shares data on the means of carrying out a suicide act, also referred to as mechanisms of…
A traumatic brain injury (TBI) can be mild, moderate or severe. It is defined as a disruption in the normal functioning of the brain due to a bump, blow, or jolt to the head or a penetrating head injury.1 It is a major cause of morbidity and mortality in the U.S. that can have life-long financial,…
Adolescence is a time when many young people start their first romantic relationships. Dating can be a new and exciting phase in teens’ lives that helps them learn more about themselves and sets the stage for future relationships. But for many teens, the dating experience can also include different…
Every year in the US, 3,572 people die from drowning. Nine hundred and forty-five of them are children. Children account for one out of four drowning deaths. This infographic from the Children's Safety Network covers the demographics of drownings, locations of drownings, near drowning, and…
Toy Injuries in U.S. Children: Know the Facts Between 2015 and 2018, U.S. children and adolescents ages 0-19 sustained over 1 million toy-related injuries that were treated in emergency departments. Common injury diagnoses related to toy injuries are laceration, contusion/abrasion, fracture,…
Health disparities are preventable differences in the burden of injury or of opportunities to achieve optimal health that are experienced by socially disadvantaged populations (Centers for Disease Control and Prevention [CDC], 2008). Health disparities are often related to the historical and…
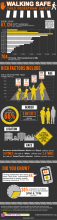
WALKING SAFE: Child Pedestrian Safety Every year:* 67,124 child** pedestrians are fatally or nonfatally injured(WISQARS, 2005-2010) Children ages 15-19 suffer the most pedestrian injures (WISQARS, 2005-2010) Age Group Average Fatal and Nonfatal Injuries per Year 0-4 yrs 6,456 5-9 yrs 12,…
Heatstroke in Cars Prevention
Motor vehicle crashes are a leading cause of death among children ages one through 14 (CDC, 2016). In 2013, an average of three children were killed and 470 were injured every day in motor vehicle crashes in the U.S. (NHTSA, 2015). Child passenger safety requires consistent use of…
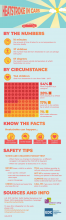
Heatstroke happens quickly and can be deadly. This infographic goes over the numbers on heatstroke in cars, the circumstances of deaths, clears up common misconceptions about heatstroke, and provides safety tips. Download a PDF of the infographic for printing BY THE NUMBERS 10 minutes: the amount…
Home Safety
Children often find or handle firearms in the home without their parents' knowledge. In the United States, 2,600,000 children live in homes with unlocked firearms that are stored loaded or with ammunition. Child Access to Firearms in the US discusses the number of children who have firearms in…
This infographic covers three types of firearm-related injuries and how they affect children and youth: homicide, suicide, and unintentional. This is the first in a three-part series of infographics about firearms. The other infographics in the series are available here: The Magnitude of…
According to the 2013 Youth Risk Behavior Survey (YRBS), nearly 15 percent of high school students have experienced electronic bullying within the past year. Sexting has become a concern as adolescents text, e-mail, or post explicit pictures of themselves or others on social networking sites.…
Toy Injuries in U.S. Children: Know the Facts Between 2015 and 2018, U.S. children and adolescents ages 0-19 sustained over 1 million toy-related injuries that were treated in emergency departments. Common injury diagnoses related to toy injuries are laceration, contusion/abrasion, fracture,…
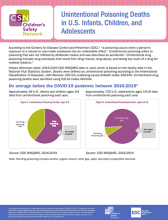
In 2020, unintentional poisoning was the second leading cause of unintentional injury deaths for children and adolescents ages 1-19. Drug poisoning was related to 73% of the unintentional poisoning deaths in children ages 0-9, and 96% of the unintentional poisoning deaths in adolescents ages 10-19…
Injury Disparities
This CSN infographic focuses on the disparities in child passenger deaths and offers prevention strategies. Download a print version of the infographic Disparities in Child Passenger Safety Motor vehicle crashes are a leading cause of death among children[*] From 2010 through 2014, an average of…
Youth who identify as lesbian, gay, bisexual, questioning, or other non-heterosexual identity (LGBQ+) are resilient1 and diverse, representing every racial, ethnic, and socioeconomic group and are present in every community across the U.S.2 They make up 24% of the high-school aged population.3…
Youth who identify as lesbian, gay, bisexual, questioning, or other non-heterosexual identity (LGBQ+) are resilient1 and diverse, representing every racial, ethnic, and socioeconomic group and are present in every community across the U.S.2 They make up 24% of the high-school aged population.3…
Youth who identify as lesbian, gay, bisexual, questioning, or other non-heterosexual identity (LGBQ+) are resilient1 and diverse, representing every racial, ethnic, and socioeconomic group and are present in every community across the U.S.2 They make up 24% of the high-school aged population.3…
This infographic focuses on the rates (per 100,000) of drug poisoning deaths of adolescents and young adults ages 10-24 from 2014-2016. It breaks out these deaths by sex, race/ethnicity, and location. Drug poisoning is defined as an improper use of illicit drugs or medicine that is either…
This infographic focuses on the homicide rates (per 100,000) of children, adolescents, and young adults ages 0 through 24 from 2014-2016. It breaks out these homicides by sex, race/ethnicity, and location. Download a PDF of the infographic for printing This is part of a series on injury…
This infographic focuses on the suicide rates (per 100,000) of adolescents and young adults ages 10 through 24 from 2014-2016. It breaks out these deaths by sex, race/ethnicity, sexual orientation, and location. Download a PDF of the infographic for printing This is part of a series on injury…
Health disparities are preventable differences in the burden of injury or of opportunities to achieve optimal health that are experienced by socially disadvantaged populations (Centers for Disease Control and Prevention [CDC], 2008). Health disparities are often related to the historical and…
Motor Vehicle Traffic Injury Prevention
Change Packages The Change Packages list the evidence-based and evidence-informed strategies that will lead to breakthrough improvement in key topic areas of child safety. The change packages are available as comprehensive resources organized across the entire socio-ecological model, and also…
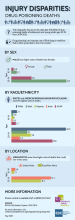
Among children and adolescents ages 0 – 19 years, most pedestrian deaths occur among males, in non-metro areas, at non-intersection locations and at night.1,2 American Indian/Alaska Native and Black children ages 0 – 19 years are at higher risk for pedestrian death and injury than other racial…
The Child Safety Learning Collaborative addresses the leading causes of child and adolescent injuries, fatalities and hospitalizations for youth ages 0-19. This data map provides statistical comparisons of national and state rates for Unintentional Motor Vehicle Traffic Fatalities.Download the PDF…
This resource was recently updated. Visit the latest version. Summarizes the incidence and cost savings of interventions to prevent injuries due to motor vehicles, impaired driving, open-flame/burns, and violence. Also includes cost savings realized by health/miscellaneous services and…
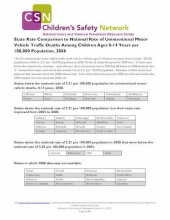
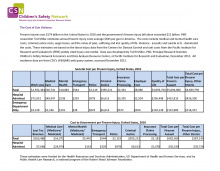
Contains the following maps: State Rate Comparison to National Rate of Unintentional Motor Vehicle Traffic Deaths Among Children Ages 0-14 Years per 100,000 Population, 2008 State Rate Comparison to National Rate of Suicide Deaths among Youth Ages 15-19 Years per 100,000 Population, 2008
In 2015, the total medical costs of injury-related deaths of children age 19 and younger was $153.2 million. This infographic breaks out the medical cost of child deaths by injury topic. Download a PDF of the infographic for printing This is part of a series on the costs of childhood injuries…
In 2015, the total medical costs of injury-related emergency department (ED) visits of children age 19 and younger was $18.3 billion. This infographic breaks out the medical cost of emergency department visits of children by injury topic. Download a PDF of the infographic for printing This is part…
In 2015, the total medical costs of injury-related hospitalizations of children age 19 and younger was $6.6 billion. This infographic breaks out the medical cost of hospitalizations of children by injury topic. Download a PDF of the infographic for printing This is part of a series on the costs of…
Off-Road Vehicles Safety
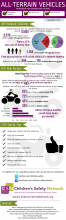
CSN released this infographic on all-terrain vehicles (ATVs), which includes information on ATV-related fatalities, ATV risk factors, and ATV safety tips. Print version of ATV Infographic
Pedestrian Safety
All Children are Pedestrians! Prevention Tips and Recent Statistics Approximately 600 children and adolescents die from pedestrian injuries each year. More than 3 in 4 pedestrian injuries in children and adolescents are related to motor vehicle traffic. Age Compared to children ages 5-9 or 10-14…
Among children and adolescents ages 0 – 19 years, most pedestrian deaths occur among males, in non-metro areas, at non-intersection locations and at night.1,2 American Indian/Alaska Native and Black children ages 0 – 19 years are at higher risk for pedestrian death and injury than other racial…
The deadliest day of the year for child pedestrians is Halloween. On average, over two times as many child pedestrians die on Halloween compared to other days. Our Halloween Safety infographic has safety facts and tips to make sure you and your children have a safe and happy Halloween! Print…
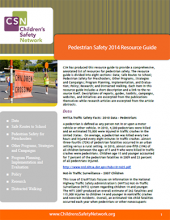
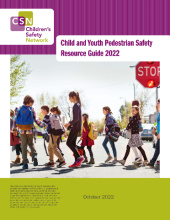
CSN has produced this resource guide to provide a comprehensive, annotated list of resources for pedestrian safety. The resource guide is divided into eight sections: Data; Safe Routes to School; Pedestrian Safety for Preschoolers; Other Programs, Strategies and Campaigns; Program Planning,…
WALKING SAFE: Child Pedestrian Safety Every year:* 67,124 child** pedestrians are fatally or nonfatally injured(WISQARS, 2005-2010) Children ages 15-19 suffer the most pedestrian injures (WISQARS, 2005-2010) Age Group Average Fatal and Nonfatal Injuries per Year 0-4 yrs 6,456 5-9 yrs 12,…
Playground Safety
This publication lists evidence-based strategies and readings on child passenger safety, falls prevention, interpersonal violence prevention, suicide and self-harm prevention, and teen driver safety.
218,851 playground-related injuries are treated in an emergency department each year. This infographic breaks down playground-related injuries by hazard, diagnosis, equipment, and age and sex. Additional resources on playground safety can be found in the text below. Click here for the print…
Poisoning Prevention
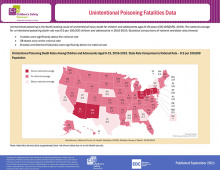
The Child Safety Learning Collaborative addresses the leading causes of child and adolescent injuries, fatalities and hospitalizations for youth ages 0-19. This data map provides statistical comparisons of national and state rates for Unintentional Poisoning Fatalities.Download the PDF of the…
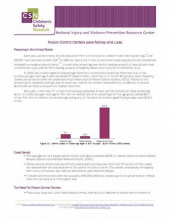
This document analyzes the cost benefits of poison control centers.
This fact sheet covers the costs of childhood injuries, including medical costs, work loss costs, and quality of life loss costs. Work loss costs include lost wages of injured persons and lost household work, or, in the case of fatality, lost earnings and household work over the victim’s…
E-cigarettes contain a liquid nicotine solution that can be poisonous. These products come in bright colors and appealing flavors and scents, making them particularly attractive to young children. Print version of infographic with sources Poster version of infographic Lethality[1] Nicotine is an…
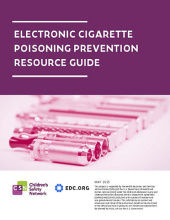
Electronic cigarettes — also known as “e-cigarettes,” “e-cigs,” “vapes,” “e-hookahs,” “vape pens,” and “electronic nicotine delivery systems”— include a wide range of battery-powered devices used to inhale nicotine and other chemicals. Although using e-cigarettes is generally thought to be less…
This infographic focuses on the rates (per 100,000) of drug poisoning deaths of adolescents and young adults ages 10-24 from 2014-2016. It breaks out these deaths by sex, race/ethnicity, and location. Drug poisoning is defined as an improper use of illicit drugs or medicine that is either…
Each year, opioid medication poisoning causes more than 300 deaths in children and teens. (1) This infographic covers poison control center calls about children and teens exposed to opioid medications. Download a print version of the infographic Opioid Medication: A Risk for Children and Teens…
In 2012, nearly 6,000 children aged 0 through 4 were hospitalized and another 55,000 were treated and released from U.S. emergency rooms for medication poisoning (Health Care Utilization Project, National Inpatient Sample and National Emergency Department Sample, 2012). These poisonings resulted in…
In 2015, the total medical costs of injury-related deaths of children age 19 and younger was $153.2 million. This infographic breaks out the medical cost of child deaths by injury topic. Download a PDF of the infographic for printing This is part of a series on the costs of childhood injuries…
In 2015, the total medical costs of injury-related emergency department (ED) visits of children age 19 and younger was $18.3 billion. This infographic breaks out the medical cost of emergency department visits of children by injury topic. Download a PDF of the infographic for printing This is part…
In 2015, the total medical costs of injury-related hospitalizations of children age 19 and younger was $6.6 billion. This infographic breaks out the medical cost of hospitalizations of children by injury topic. Download a PDF of the infographic for printing This is part of a series on the costs of…
In 2020, unintentional poisoning was the second leading cause of unintentional injury deaths for children and adolescents ages 1-19. Drug poisoning was related to 73% of the unintentional poisoning deaths in children ages 0-9, and 96% of the unintentional poisoning deaths in adolescents ages 10-19…
Prescription Drug Misuse Prevention
Youth who identify as lesbian, gay, bisexual, questioning, or other non-heterosexual identity (LGBQ+) are resilient1 and diverse, representing every racial, ethnic, and socioeconomic group and are present in every community across the U.S.2 They make up 24% of the high-school aged population.3…
Youth who identify as lesbian, gay, bisexual, questioning, or other non-heterosexual identity (LGBQ+) are resilient1 and diverse, representing every racial, ethnic, and socioeconomic group and are present in every community across the U.S.2 They make up 24% of the high-school aged population.3…
Youth who identify as lesbian, gay, bisexual, questioning, or other non-heterosexual identity (LGBQ+) are resilient1 and diverse, representing every racial, ethnic, and socioeconomic group and are present in every community across the U.S.2 They make up 24% of the high-school aged population.3…
The amount of prescription painkillers prescribed and sold in the U.S. increased nearly four times from 1999 to 2010 (CDC), yet there has not been an overall change in the amount of pain that Americans report. (Chang, H., American Journal of Emergency Medicine, 2014). Prescription and over-the-…
Each year, opioid medication poisoning causes more than 300 deaths in children and teens. (1) This infographic covers poison control center calls about children and teens exposed to opioid medications. Download a print version of the infographic Opioid Medication: A Risk for Children and Teens…
In 2015, the total medical costs of injury-related deaths of children age 19 and younger was $153.2 million. This infographic breaks out the medical cost of child deaths by injury topic. Download a PDF of the infographic for printing This is part of a series on the costs of childhood injuries…
In 2015, the total medical costs of injury-related emergency department (ED) visits of children age 19 and younger was $18.3 billion. This infographic breaks out the medical cost of emergency department visits of children by injury topic. Download a PDF of the infographic for printing This is part…
In 2020, unintentional poisoning was the second leading cause of unintentional injury deaths for children and adolescents ages 1-19. Drug poisoning was related to 73% of the unintentional poisoning deaths in children ages 0-9, and 96% of the unintentional poisoning deaths in adolescents ages 10-19…
Rural & Farm Safety
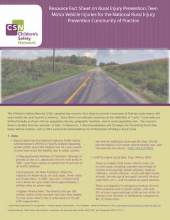
CSN compiled this resource fact sheet to provide Community of Practice state teams with more details on rural injuries in America. The resource sheet is divided into four sections—1) Data, 2) Resources, 3) Recommendations and Strategies for Preventing Rural Teen Motor Vehicle Crashes, and 4) CSN’s…
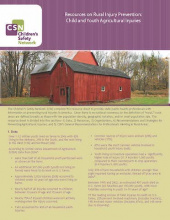
The Children’s Safety Network (CSN) compiled this resource sheet to provide state public health professionals with information on preventing rural injuries in America. Since there is no national consensus on the definition of “rural,” rural areas are defined broadly as those with…
Safe Sleep
The Child Safety Learning Collaborative addresses the leading causes of child and adolescent injuries, fatalities and hospitalizations for youth ages 0-19. This data map provides statistical comparisons of national and state rates for Sudden Unexpected Infant Deaths.Download the PDF of the…
The Child Safety Learning Collaborative addresses the leading causes of child and adolescent injuries, fatalities and hospitalizations for youth ages 0-19. This data map provides statistical comparisons of national and state rates for sudden unexpected infant deaths. For data maps covering earlier…
Sudden Unexpected Infant Death (SUID) refers to the sudden and unexpected death of an infant younger than one year of age. This infographic goes over the definition of SUID, the racial/ethnic differences in SUID rates, risk factors for SUID and provides resources on reducing SUID and…
Self-Harm Prevention
Childhood lays the foundation for future success, with safe and supportive environments promoting healthier adult outcomes. Adverse Childhood Experiences (ACEs) can lead to long-term social, behavioral, and health challenges. Preventing and addressing ACEs is vital, and requires family, community,…
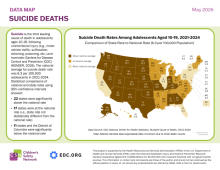
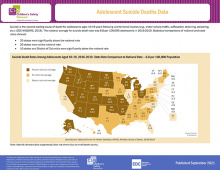
The Child Safety Learning Collaborative addresses the leading causes of child and adolescent injuries, fatalities and hospitalizations for youth ages 0-19. This data map provides statistical comparisons of national and state rates for adolescent suicide deaths. For data maps covering earlier years…
The Child Safety Learning Collaborative addresses the leading causes of child and adolescent injuries, fatalities and hospitalizations for youth ages 0-19. This data map provides statistical comparisons of national and state rates for Bullying Victimization (2023), Sudden Unexpected Infant…
Youth who identify as lesbian, gay, bisexual, questioning, or other non-heterosexual identity (LGBQ+) are resilient1 and diverse, representing every racial, ethnic, and socioeconomic group and are present in every community across the U.S.2 They make up 24% of the high-school aged population.3…
Youth who identify as lesbian, gay, bisexual, questioning, or other non-heterosexual identity (LGBQ+) are resilient1 and diverse, representing every racial, ethnic, and socioeconomic group and are present in every community across the U.S.2 They make up 24% of the high-school aged population.3…
Youth who identify as lesbian, gay, bisexual, questioning, or other non-heterosexual identity (LGBQ+) are resilient1 and diverse, representing every racial, ethnic, and socioeconomic group and are present in every community across the U.S.2 They make up 24% of the high-school aged population.3…

This page features a series of podcast interviews CSN has conducted across the numerous child safety topics we address. Interviewees include active members of the Children's Safety Now Alliance.For more information about each podcast episode and to listen…
Sports Safety
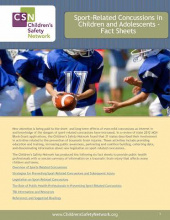
New attention is being paid to the short- and long-term effects of even mild concussions as interest in and knowledge of the dangers of sport-related concussions have increased. In a review of state 2012 MCH Block Grant applications, the Children’s Safety Network found that 31 states described…
In 2015, the total medical costs of injury-related deaths of children age 19 and younger was $153.2 million. This infographic breaks out the medical cost of child deaths by injury topic. Download a PDF of the infographic for printing This is part of a series on the costs of childhood injuries…
In 2015, the total medical costs of injury-related emergency department (ED) visits of children age 19 and younger was $18.3 billion. This infographic breaks out the medical cost of emergency department visits of children by injury topic. Download a PDF of the infographic for printing This is part…
In 2015, the total medical costs of injury-related hospitalizations of children age 19 and younger was $6.6 billion. This infographic breaks out the medical cost of hospitalizations of children by injury topic. Download a PDF of the infographic for printing This is part of a series on the costs of…
This resource was recently updated. Visit the latest version. CSN is pleased to provide this resource guide on the critical issue of traumatic brain injury (TBI). Studies have found that the four most common causes of TBI are falls, motor vehicle/traffic crashes, struck by/against events,…
Substance Misuse Prevention
This fact sheet covers the costs of childhood injuries, including medical costs, work loss costs, and quality of life loss costs. Work loss costs include lost wages of injured persons and lost household work, or, in the case of fatality, lost earnings and household work over the victim’s…
Youth who identify as lesbian, gay, bisexual, questioning, or other non-heterosexual identity (LGBQ+) are resilient1 and diverse, representing every racial, ethnic, and socioeconomic group and are present in every community across the U.S.2 They make up 24% of the high-school aged population.3…
Youth who identify as lesbian, gay, bisexual, questioning, or other non-heterosexual identity (LGBQ+) are resilient1 and diverse, representing every racial, ethnic, and socioeconomic group and are present in every community across the U.S.2 They make up 24% of the high-school aged population.3…
Youth who identify as lesbian, gay, bisexual, questioning, or other non-heterosexual identity (LGBQ+) are resilient1 and diverse, representing every racial, ethnic, and socioeconomic group and are present in every community across the U.S.2 They make up 24% of the high-school aged population.3…
This infographic focuses on the rates (per 100,000) of drug poisoning deaths of adolescents and young adults ages 10-24 from 2014-2016. It breaks out these deaths by sex, race/ethnicity, and location. Drug poisoning is defined as an improper use of illicit drugs or medicine that is either…
This resource was recently updated. Visit the latest version. Summarizes the incidence and cost savings of interventions to prevent injuries due to motor vehicles, impaired driving, open-flame/burns, and violence. Also includes cost savings realized by health/miscellaneous services and…
According to the 2013 Youth Risk Behavior Survey (YRBS), nearly 15 percent of high school students have experienced electronic bullying within the past year. Sexting has become a concern as adolescents text, e-mail, or post explicit pictures of themselves or others on social networking sites.…
In 2015, the total medical costs of injury-related deaths of children age 19 and younger was $153.2 million. This infographic breaks out the medical cost of child deaths by injury topic. Download a PDF of the infographic for printing This is part of a series on the costs of childhood injuries…
In 2015, the total medical costs of injury-related emergency department (ED) visits of children age 19 and younger was $18.3 billion. This infographic breaks out the medical cost of emergency department visits of children by injury topic. Download a PDF of the infographic for printing This is part…
In 2015, the total medical costs of injury-related hospitalizations of children age 19 and younger was $6.6 billion. This infographic breaks out the medical cost of hospitalizations of children by injury topic. Download a PDF of the infographic for printing This is part of a series on the costs of…
Self Harm and Suicide Prevention
Childhood lays the foundation for future success, with safe and supportive environments promoting healthier adult outcomes. Adverse Childhood Experiences (ACEs) can lead to long-term social, behavioral, and health challenges. Preventing and addressing ACEs is vital, and requires family, community,…
Change Packages The Change Packages list the evidence-based and evidence-informed strategies that will lead to breakthrough improvement in key topic areas of child safety. The change packages are available as comprehensive resources organized across the entire socio-ecological model, and also…
The Child Safety Learning Collaborative addresses the leading causes of child and adolescent injuries, fatalities and hospitalizations for youth ages 0-19. This data map provides statistical comparisons of national and state rates for Adolescent Suicide Deaths.Download the PDF of the Publication
The Child Safety Learning Collaborative addresses the leading causes of child and adolescent injuries, fatalities and hospitalizations for youth ages 0-19. This data map provides statistical comparisons of national and state rates for adolescent suicide deaths. For data maps covering earlier years…
The Child Safety Learning Collaborative addresses the leading causes of child and adolescent injuries, fatalities and hospitalizations for youth ages 0-19. This data map provides statistical comparisons of national and state rates for Bullying Victimization (2023), Sudden Unexpected Infant…
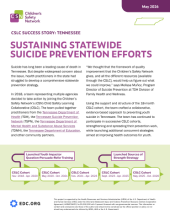
State teams participating in the Children’s Safety Network’s Child Safety Learning Collaborative (CSLC) are strengthening child safety systems and preventing injury and violence through partnership, data-driven strategies, and quality improvement and innovation. These case studies highlight how…
This fact sheet covers the costs of childhood injuries, including medical costs, work loss costs, and quality of life loss costs. Work loss costs include lost wages of injured persons and lost household work, or, in the case of fatality, lost earnings and household work over the victim’s…
This publication lists evidence-based strategies and readings on child passenger safety, falls prevention, interpersonal violence prevention, suicide and self-harm prevention, and teen driver safety.
On average, over 3,000 U.S. children and adolescents die each year from a firearm injury. Approximately nine children and adolescents ages 0 to 19 die by firearm injury each day in the United States, with about five of those deaths being homicide-related and three being suicide-related. In the…
FIREARM SAFETY: Preventing Death by Suicide Firearm suicides are the fourth leading cause of injury death for children ages (10-19).* Approximately nine children and adolescents ages 10 to 19 die by firearm injury each day in the U.S., and about three of those deaths are suicide-related…
This infographic covers three types of firearm-related injuries and how they affect children and youth: homicide, suicide, and unintentional. This is the first in a three-part series of infographics about firearms. The other infographics in the series are available here: The Magnitude of…
The following fact sheet provides information about firearm-related injuries and deaths among the 0 through 14 year old population in the United States. It contains a review of data and information about the magnitude of the problem, shows how different demographic groups…
The following fact sheet provides information about firearm-related injuries and deaths among 15 through 24 year olds in the United States. It contains a review of data and information about the magnitude of the problem, shows how different demographic groups are impacted,…
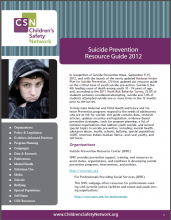
In recognition of Suicide Prevention Week, September 9-15, 2012, and with the launch of the newly updated National Action Plan for Suicide Prevention, CSN has updated our resource guide on the critical issue of youth suicide prevention. Suicide is the 4th leading cause of death among youth 10 - 24…
Youth who identify as lesbian, gay, bisexual, questioning, or other non-heterosexual identity (LGBQ+) are resilient1 and diverse, representing every racial, ethnic, and socioeconomic group and are present in every community across the U.S.2 They make up 24% of the high-school aged population.3…
Youth who identify as lesbian, gay, bisexual, questioning, or other non-heterosexual identity (LGBQ+) are resilient1 and diverse, representing every racial, ethnic, and socioeconomic group and are present in every community across the U.S.2 They make up 24% of the high-school aged population.3…
Youth who identify as lesbian, gay, bisexual, questioning, or other non-heterosexual identity (LGBQ+) are resilient1 and diverse, representing every racial, ethnic, and socioeconomic group and are present in every community across the U.S.2 They make up 24% of the high-school aged population.3…
This infographic focuses on the suicide rates (per 100,000) of adolescents and young adults ages 10 through 24 from 2014-2016. It breaks out these deaths by sex, race/ethnicity, sexual orientation, and location. Download a PDF of the infographic for printing This is part of a series on injury…
According to the 2013 Youth Risk Behavior Survey (YRBS), nearly 15 percent of high school students have experienced electronic bullying within the past year. Sexting has become a concern as adolescents text, e-mail, or post explicit pictures of themselves or others on social networking sites.…
In 2010, 6,581 children and youth ages 0-24 died from firearm-related injuries in the US. The Magnitude of Firearm-Related Fatalities in Children and Youth breaks down the firearm-related fatalities of children and youth by age and intent. This is the second infographic in a three-part series…
Contains the following maps: State Rate Comparison to National Rate of Unintentional Motor Vehicle Traffic Deaths Among Children Ages 0-14 Years per 100,000 Population, 2008 State Rate Comparison to National Rate of Suicide Deaths among Youth Ages 15-19 Years per 100,000 Population, 2008
This page features a series of podcast interviews CSN has conducted across the numerous child safety topics we address. Interviewees include active members of the Children's Safety Now Alliance.For more information about each podcast episode and to listen…
Suicide is a complex and preventable multi-factor, multi-level health outcome. Effective prevention requires understanding data such as who is at risk and the factors associated with suicide. This fact sheet shares data on the means of carrying out a suicide act, also referred to as mechanisms of…
In 2015, the total medical costs of injury-related deaths of children age 19 and younger was $153.2 million. This infographic breaks out the medical cost of child deaths by injury topic. Download a PDF of the infographic for printing This is part of a series on the costs of childhood injuries…
In 2015, the total medical costs of injury-related emergency department (ED) visits of children age 19 and younger was $18.3 billion. This infographic breaks out the medical cost of emergency department visits of children by injury topic. Download a PDF of the infographic for printing This is part…
In 2015, the total medical costs of injury-related hospitalizations of children age 19 and younger was $6.6 billion. This infographic breaks out the medical cost of hospitalizations of children by injury topic. Download a PDF of the infographic for printing This is part of a series on the costs of…
Suicide is the second leading cause of death for U.S. children and youth ages 10 through 24, claiming an average of 5,390 lives per year (Centers for Disease Control and Prevention, WISQARS Leading Cause of Death, Ages 10–24, 2011–2015). The CDC’s 2015 Youth Risk Behavior Survey (YRBS) found that…
CSN's National Injury and Violence Prevention Resource Center prepared this analysis and summary of state MCH plans on youth suicide prevention to inform MCH programs about what states are doing to address NPM #16 (Reduce the rate (per 100,000) of suicide deaths among youths aged 15 through 19) and…
Teen Dating Violence Prevention
This fact sheet covers the costs of childhood injuries, including medical costs, work loss costs, and quality of life loss costs. Work loss costs include lost wages of injured persons and lost household work, or, in the case of fatality, lost earnings and household work over the victim’s…
This publication lists evidence-based strategies and readings on child passenger safety, falls prevention, interpersonal violence prevention, suicide and self-harm prevention, and teen driver safety.
Youth who identify as lesbian, gay, bisexual, questioning, or other non-heterosexual identity (LGBQ+) are resilient1 and diverse, representing every racial, ethnic, and socioeconomic group and are present in every community across the U.S.2 They make up 24% of the high-school aged population.3…
Youth who identify as lesbian, gay, bisexual, questioning, or other non-heterosexual identity (LGBQ+) are resilient1 and diverse, representing every racial, ethnic, and socioeconomic group and are present in every community across the U.S.2 They make up 24% of the high-school aged population.3…
Youth who identify as lesbian, gay, bisexual, questioning, or other non-heterosexual identity (LGBQ+) are resilient1 and diverse, representing every racial, ethnic, and socioeconomic group and are present in every community across the U.S.2 They make up 24% of the high-school aged population.3…
This infographic focuses on the homicide rates (per 100,000) of children, adolescents, and young adults ages 0 through 24 from 2014-2016. It breaks out these homicides by sex, race/ethnicity, and location. Download a PDF of the infographic for printing This is part of a series on injury…
Teen dating abuse is physical, sexual, or emotional abuse (including stalking) that occurs between teens and pre-teens in a relationship. It can take place in person or online, and can involve a current or past partner (CDC, 2016). Teen dating abuse is quite common, affecting around one in…
This fact sheet provides information and data on teen dating violence, describes evidence-informed interventions to reduce teen dating violence behavior, offers examples of state efforts to prevent dating violence, and lists specific steps that public health professionals can take to play an active…
Adolescence is a time when many young people start their first romantic relationships. Dating can be a new and exciting phase in teens’ lives that helps them learn more about themselves and sets the stage for future relationships. But for many teens, the dating experience can also include different…
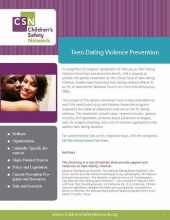
In recognition of Congress' designation of February as Teen Dating Violence Prevention and Awareness Month, CSN is pleased to provide this special newsletter on the critical issue of teen dating violence. Studies have found that teen dating violence affects 9% to 35% of adolescents (National…
In 2015, the total medical costs of injury-related deaths of children age 19 and younger was $153.2 million. This infographic breaks out the medical cost of child deaths by injury topic. Download a PDF of the infographic for printing This is part of a series on the costs of childhood injuries…
In 2015, the total medical costs of injury-related emergency department (ED) visits of children age 19 and younger was $18.3 billion. This infographic breaks out the medical cost of emergency department visits of children by injury topic. Download a PDF of the infographic for printing This is part…
In 2015, the total medical costs of injury-related hospitalizations of children age 19 and younger was $6.6 billion. This infographic breaks out the medical cost of hospitalizations of children by injury topic. Download a PDF of the infographic for printing This is part of a series on the costs of…
Teen Driving Safety
CSN compiled this resource fact sheet to provide Community of Practice state teams with more details on rural injuries in America. The resource sheet is divided into four sections—1) Data, 2) Resources, 3) Recommendations and Strategies for Preventing Rural Teen Motor Vehicle Crashes, and 4) CSN’s…
Change Packages The Change Packages list the evidence-based and evidence-informed strategies that will lead to breakthrough improvement in key topic areas of child safety. The change packages are available as comprehensive resources organized across the entire socio-ecological model, and also…
The Child Safety Learning Collaborative addresses the leading causes of child and adolescent injuries, fatalities and hospitalizations for youth ages 0-19. This data map provides statistical comparisons of national and state rates for Unintentional Motor Vehicle Traffic Fatalities.Download the PDF…
The Child Safety Learning Collaborative addresses the leading causes of child and adolescent injuries, fatalities and hospitalizations for youth ages 0-19. This data map provides statistical comparisons of national and state rates for unintentional motor vehicle traffic fatalities. For data…
The Child Safety Learning Collaborative addresses the leading causes of child and adolescent injuries, fatalities and hospitalizations for youth ages 0-19. This data map provides statistical comparisons of national and state rates for Bullying Victimization (2023), Sudden Unexpected Infant…
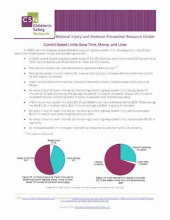
This fact sheet shows the benefits of current speed limits, including money, time, and lives saved.
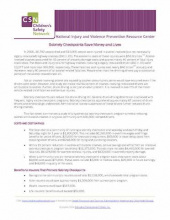
This fact sheet shows the importance of sobriety checkpoints in preventing injuries and death while simultaneously saving money.
This fact sheet covers the costs of childhood injuries, including medical costs, work loss costs, and quality of life loss costs. Work loss costs include lost wages of injured persons and lost household work, or, in the case of fatality, lost earnings and household work over the victim’s…
This publication lists evidence-based strategies and readings on child passenger safety, falls prevention, interpersonal violence prevention, suicide and self-harm prevention, and teen driver safety.
This set of resources was originally prepared for a training titled “Initiative to Enhance Seat Belt Use by Adolescents in New Hampshire Communities”. It is intended to serve as an overview of efforts that have been shown to increase seat belt use among teens.
This resource was recently updated. Visit the latest version. Summarizes the incidence and cost savings of interventions to prevent injuries due to motor vehicles, impaired driving, open-flame/burns, and violence. Also includes cost savings realized by health/miscellaneous services and…
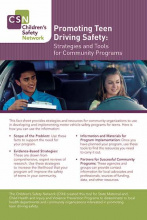
This brochure is the second in a series that is being created in response to requests from State health departments for information on best practices for local programs. The publication includes information about the scope of teen driving injuries and fatalities.
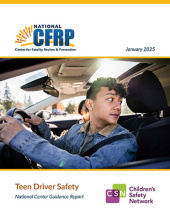
Teenagers are disproportionately impacted by motor vehicle crashes compared to other age groups. The Teen Driver Safety National Center Guidance Report provides an evidence-based overview of teen crashes and practical strategies to prevent them. Drawing on national data, child death review findings…

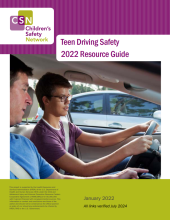
This resource was recently updated. Visit the latest version. Teenagers contribute to, and suffer from, the consequences of motor vehicle collisions at a disproportionate rate. Motor vehicle crashes are the leading cause of death for youth ages 15–20. According to the National Highway…
In 2019, 4,356 people were killed in crashes involving young drivers (aged 15 - 20). Of these fatalities, 1,603 were young drivers.1 Teenagers contribute to, and suffer from, the consequences of motor vehicle collisions at a disproportionate rate. Teen drivers ages 16 - 19 are nearly three times as…
In 2015, the total medical costs of injury-related deaths of children age 19 and younger was $153.2 million. This infographic breaks out the medical cost of child deaths by injury topic. Download a PDF of the infographic for printing This is part of a series on the costs of childhood injuries…
In 2015, the total medical costs of injury-related emergency department (ED) visits of children age 19 and younger was $18.3 billion. This infographic breaks out the medical cost of emergency department visits of children by injury topic. Download a PDF of the infographic for printing This is part…
Traumatic Brain Injuries Prevention
This fact sheet covers the costs of childhood injuries, including medical costs, work loss costs, and quality of life loss costs. Work loss costs include lost wages of injured persons and lost household work, or, in the case of fatality, lost earnings and household work over the victim’s…
New attention is being paid to the short- and long-term effects of even mild concussions as interest in and knowledge of the dangers of sport-related concussions have increased. In a review of state 2012 MCH Block Grant applications, the Children’s Safety Network found that 31 states described…
This publication lists evidence-based strategies and readings on child passenger safety, falls prevention, interpersonal violence prevention, suicide and self-harm prevention, and teen driver safety.
Each year, more than one million youth ages 0 through 19 sustain a non-fatal traumatic brain injury (TBI) (NEISS; NEISS –AIP 2007-2009). With the passage of legislation in all states and the District of Columbia to prevent and manage youth sports concussions, awareness of TBI is on the rise.…
A traumatic brain injury (TBI) can be mild, moderate or severe. It is defined as a disruption in the normal functioning of the brain due to a bump, blow, or jolt to the head or a penetrating head injury.1 It is a major cause of morbidity and mortality in the U.S. that can have life-long financial,…
In 2015, the total medical costs of injury-related deaths of children age 19 and younger was $153.2 million. This infographic breaks out the medical cost of child deaths by injury topic. Download a PDF of the infographic for printing This is part of a series on the costs of childhood injuries…
In 2015, the total medical costs of injury-related emergency department (ED) visits of children age 19 and younger was $18.3 billion. This infographic breaks out the medical cost of emergency department visits of children by injury topic. Download a PDF of the infographic for printing This is part…
This resource was recently updated. Visit the latest version. CSN is pleased to provide this resource guide on the critical issue of traumatic brain injury (TBI). Studies have found that the four most common causes of TBI are falls, motor vehicle/traffic crashes, struck by/against events,…
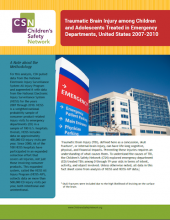
Traumatic Brain Injury (TBI), defined here as a concussion, skull fracture, or internal brain injury, can have life-long cognitive, physical, and financial impacts. Preventing these injuries requires an understanding of what causes them. To understand the causes of TBI, the…
Traumatic brain injury (TBI), a condition caused by a bump, blow or jolt to the head which disrupts normal brain function, is a major cause of death and disability in the United States. Nearly 700,000 TBI-related emergency department visits, hospitalizations, and deaths occur annually in US…
Violence Prevention
Change Packages The Change Packages list the evidence-based and evidence-informed strategies that will lead to breakthrough improvement in key topic areas of child safety. The change packages are available as comprehensive resources organized across the entire socio-ecological model, and also…
This fact sheet covers the costs of childhood injuries, including medical costs, work loss costs, and quality of life loss costs. Work loss costs include lost wages of injured persons and lost household work, or, in the case of fatality, lost earnings and household work over the victim’s…
This publication lists evidence-based strategies and readings on child passenger safety, falls prevention, interpersonal violence prevention, suicide and self-harm prevention, and teen driver safety.
On average, over 3,000 U.S. children and adolescents die each year from a firearm injury. Approximately nine children and adolescents ages 0 to 19 die by firearm injury each day in the United States, with about five of those deaths being homicide-related and three being suicide-related. In the…
This infographic covers three types of firearm-related injuries and how they affect children and youth: homicide, suicide, and unintentional. This is the first in a three-part series of infographics about firearms. The other infographics in the series are available here: The Magnitude of…
The following fact sheet provides information about firearm-related injuries and deaths among the 0 through 14 year old population in the United States. It contains a review of data and information about the magnitude of the problem, shows how different demographic groups…
The following fact sheet provides information about firearm-related injuries and deaths among 15 through 24 year olds in the United States. It contains a review of data and information about the magnitude of the problem, shows how different demographic groups are impacted,…
With back-to-school around the corner, CSN is providing this special issue of our newsletter on preventing injuries at school. This newsletter issue contains information on organizations working to create safe environments in schools, data and research on youth risk behavior, school crime data, and…
In 2013, US high school students took the CDC’s Youth Risk Behavior Survey. This infographic outlines some of the findings related to bullying and fighting. Download a printable PDF of the infographic How Common Are Bullying and Fighting among High Schoolers? In 2013, US high school students…
Youth who identify as lesbian, gay, bisexual, questioning, or other non-heterosexual identity (LGBQ+) are resilient1 and diverse, representing every racial, ethnic, and socioeconomic group and are present in every community across the U.S.2 They make up 24% of the high-school aged population.3…
Youth who identify as lesbian, gay, bisexual, questioning, or other non-heterosexual identity (LGBQ+) are resilient1 and diverse, representing every racial, ethnic, and socioeconomic group and are present in every community across the U.S.2 They make up 24% of the high-school aged population.3…
This infographic focuses on the homicide rates (per 100,000) of children, adolescents, and young adults ages 0 through 24 from 2014-2016. It breaks out these homicides by sex, race/ethnicity, and location. Download a PDF of the infographic for printing This is part of a series on injury…
This resource was recently updated. Visit the latest version. Summarizes the incidence and cost savings of interventions to prevent injuries due to motor vehicles, impaired driving, open-flame/burns, and violence. Also includes cost savings realized by health/miscellaneous services and…
In 2010, 6,581 children and youth ages 0-24 died from firearm-related injuries in the US. The Magnitude of Firearm-Related Fatalities in Children and Youth breaks down the firearm-related fatalities of children and youth by age and intent. This is the second infographic in a three-part series…
In 2015, the total medical costs of injury-related deaths of children age 19 and younger was $153.2 million. This infographic breaks out the medical cost of child deaths by injury topic. Download a PDF of the infographic for printing This is part of a series on the costs of childhood injuries…
In 2015, the total medical costs of injury-related emergency department (ED) visits of children age 19 and younger was $18.3 billion. This infographic breaks out the medical cost of emergency department visits of children by injury topic. Download a PDF of the infographic for printing This is part…
In 2015, the total medical costs of injury-related hospitalizations of children age 19 and younger was $6.6 billion. This infographic breaks out the medical cost of hospitalizations of children by injury topic. Download a PDF of the infographic for printing This is part of a series on the costs of…
Workforce Development
This brief describes why health plans would want to invest in injury prevention and how they can help prevent adolescent injury, thereby reducing injuryrelated mortality and health care spending for adolescents.