Every year, an average of 67,124 child pedestrians are injured. 704 of those child pedestrians die. As it grows darker earlier, child pedestrians become harder to see. 36% of the deaths of children under 16 occurred between 3:00 and 7:00 PM. This infographic from Children's Safety Network covers deaths, risk factors, and more about child pedestrians.
Print Version of Walking Safe: Child Pedestrian Safety Infographic
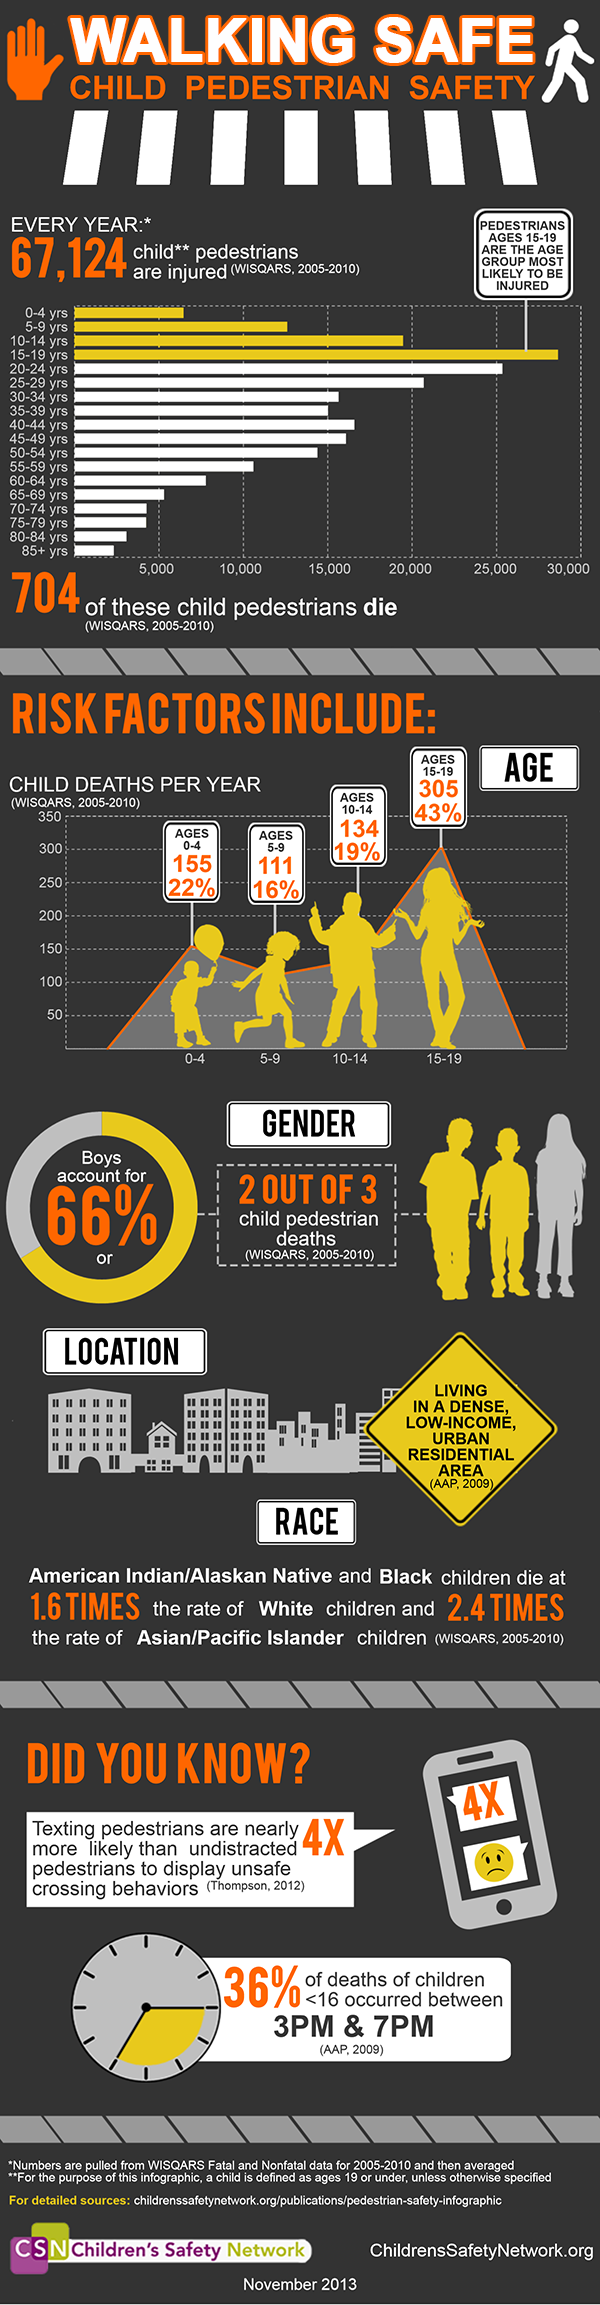
WALKING SAFE: Child Pedestrian Safety
Every year:* 67,124 child** pedestrians are fatally or nonfatally injured(WISQARS, 2005-2010)
Children ages 15-19 suffer the most pedestrian injures (WISQARS, 2005-2010)
| Age Group | Average Fatal and Nonfatal Injuries per Year |
| 0-4 yrs | 6,456 |
| 5-9 yrs | 12,575 |
| 10-14 yrs | 19,462 |
| 15-19 yrs | 28,631 |
| 20-24 yrs | 25,331 |
| 25-29 yrs | 20,683 |
| 30-34 yrs | 15,638 |
| 35-39 yrs | 15,004 |
| 40-44 yrs | 16,561 |
| 45-49 yrs | 16,083 |
| 50-54 yrs | 14,379 |
| 55-59 yrs | 10,597 |
| 60-64 yrs | 7,774 |
| 65-69 yrs | 5,304 |
| 70-74 yrs | 4,248 |
| 75-79 yrs | 4,247 |
| 80-84 yrs | 3,067 |
| 85+ yrs | 2,311 |
704 of these child pedestrians die (WISQARS, 2005-2010)
RISK FACTORS INCLUDE:
AGE (WISQARS, 2005-2010)
| Age | Average Deaths | Percent |
| 0-4 | 155 | 22% |
| 5-9 | 111 | 16% |
| 10-14 | 134 | 19% |
| 15-19 | 305 | 43% |
GENDER Boys account for 66% or 2/3 child pedestrian deaths (WISQARS, 2005-2010)
LOCATION Living in a dense, low-income, urban residential area (American Academy of Pediatrics, 2009)
RACE American Indian/Alaskan Native & Black children die at 1.6 times the rate of White children and 2.4 times the rate of Asian/Pacific Islander children (WISQARS, 2005-2010)
DID YOU KNOW?
36% of deaths of children <16 occurred between 3pm and 7pm (American Academy of Pediatrics, 2009)
Texting pedestrians are nearly 4x more likely than undistracted pedestrians to display unsafe crossing behaviors (Thompson, Rivara, Ayyagari, & Ebel, 2012)
ABOUT
*Numbers are pulled from WISQARS Fatal and Nonfatal data for 2005-2010 and then averaged
**For the purpose of this infographic, a child is defined as ages 19 or under, unless otherwise specified
For detailed sources: https://www.childrenssafetynetwork.org/infographics/walking-safe-child-pedestrian-safety
SOURCES
WISQARS. (2005-2010). Fatal Injury Data. WISQARS (p. Accessed July 29, 2013 by R. Willmer). Atlanta, GA. Retrieved from http://www.cdc.gov/injury/wisqars/fatal.html
WISQARS. (2005-2010). Nonfatal Injury Data. WISQARS (p. Accessed July 29, 2013 by R. Willmer). Atlanta, GA. Retrieved from http://www.cdc.gov/injury/wisqars/nonfatal.html
American Academy of Pediatrics. (2009). Policy statement--Pedestrian safety. Pediatrics, 124(2), 802–12. doi:10.1542/peds.2009-1143
Thompson, L. L., Rivara, F. P., Ayyagari, R. C., & Ebel, B. E. (2012). Impact of social and technological distraction on pedestrian crossing behaviour: an observational study. Injury prevention journal of the International Society for Child and Adolescent Injury Prevention. doi:10.1136/injuryprev-2012-040601