CSN Infographics
![]() This page displays all infographics created by the Children’s Safety Network (CSN) using Piktochart. Please feel free to download and share through Facebook, X, Pinterest, or email.
This page displays all infographics created by the Children’s Safety Network (CSN) using Piktochart. Please feel free to download and share through Facebook, X, Pinterest, or email.
Released Date:
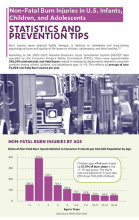
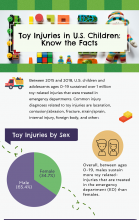
Burn injuries cause physical bodily damage, in addition to immediate and long-lasting psychological harm and quality of life losses to children, adolescents, and their families.1-3 According to the 2020-2023 National Electronic Injury Surveillance System (NEISS)4 data operated by the Consumer…
Released Date:
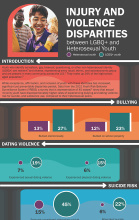
Youth who identify as lesbian, gay, bisexual, questioning, or other non-heterosexual identity (LGBQ+) are resilient1 and diverse, representing every racial, ethnic, and socioeconomic group and are present in every community across the U.S.2 They make up 24% of the high-school aged population.3…
Released Date:
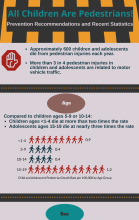
All Children are Pedestrians! Prevention Tips and Recent Statistics Approximately 600 children and adolescents die from pedestrian injuries each year. More than 3 in 4 pedestrian injuries in children and adolescents are related to motor vehicle traffic. Age Compared to children ages 5-9 or 10-14…

Released Date:
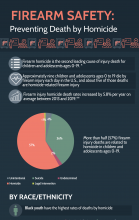
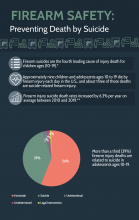
On average, over 3,000 U.S. children and adolescents die each year from a firearm injury. Approximately nine children and adolescents ages 0 to 19 die by firearm injury each day in the United States, with about five of those deaths being homicide-related and three being suicide-related. In the…
Released Date:
FIREARM SAFETY: Preventing Death by Homicide Firearm homicide is the second leading cause of injury death for children and adolescents ages 0-19. * Approximately nine children and adolescents ages 0 to 19 die by firearm injury each day in the U.S., and about five of those deaths are homicide…
Released Date:
FIREARM SAFETY: Preventing Death by Suicide Firearm suicides are the fourth leading cause of injury death for children ages (10-19).* Approximately nine children and adolescents ages 10 to 19 die by firearm injury each day in the U.S., and about three of those deaths are suicide-related…
Released Date:
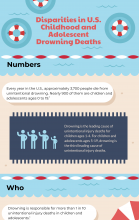
Numbers Drowning is the leading cause of unintentional injury deaths for children ages 1-4. For children and adolescents ages 5-19, drowning is the third leading cause of unintentional injury deaths. Every year in the U.S., approximately 3,700 people die from unintentional drowning. Nearly 900 of…
Released Date:
Toy Injuries in U.S. Children: Know the Facts Between 2015 and 2018, U.S. children and adolescents ages 0-19 sustained over 1 million toy-related injuries that were treated in emergency departments. Common injury diagnoses related to toy injuries are laceration, contusion/abrasion, fracture,…
Released Date:
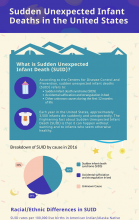
Sudden Unexpected Infant Death (SUID) refers to the sudden and unexpected death of an infant younger than one year of age. This infographic goes over the definition of SUID, the racial/ethnic differences in SUID rates, risk factors for SUID and provides resources on reducing SUID and…
Released Date:
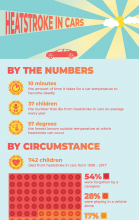
Heatstroke happens quickly and can be deadly. This infographic goes over the numbers on heatstroke in cars, the circumstances of deaths, clears up common misconceptions about heatstroke, and provides safety tips. Download a PDF of the infographic for printing BY THE NUMBERS 10 minutes: the amount…
Released Date:
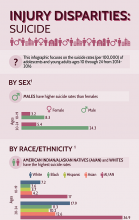
This infographic focuses on the suicide rates (per 100,000) of adolescents and young adults ages 10 through 24 from 2014-2016. It breaks out these deaths by sex, race/ethnicity, sexual orientation, and location. Download a PDF of the infographic for printing This is part of a series on injury…
Released Date:
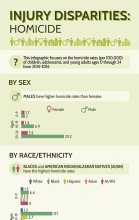
This infographic focuses on the homicide rates (per 100,000) of children, adolescents, and young adults ages 0 through 24 from 2014-2016. It breaks out these homicides by sex, race/ethnicity, and location. Download a PDF of the infographic for printing This is part of a series on injury…
Released Date:
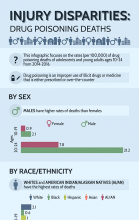
This infographic focuses on the rates (per 100,000) of drug poisoning deaths of adolescents and young adults ages 10-24 from 2014-2016. It breaks out these deaths by sex, race/ethnicity, and location. Drug poisoning is defined as an improper use of illicit drugs or medicine that is either…
Released Date:
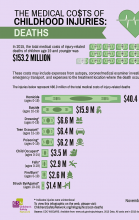
In 2015, the total medical costs of injury-related deaths of children age 19 and younger was $153.2 million. This infographic breaks out the medical cost of child deaths by injury topic. Download a PDF of the infographic for printing This is part of a series on the costs of childhood injuries…
Released Date:
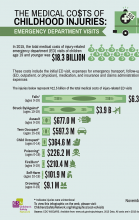
In 2015, the total medical costs of injury-related emergency department (ED) visits of children age 19 and younger was $18.3 billion. This infographic breaks out the medical cost of emergency department visits of children by injury topic. Download a PDF of the infographic for printing This is part…
Released Date:
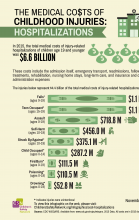
In 2015, the total medical costs of injury-related hospitalizations of children age 19 and younger was $6.6 billion. This infographic breaks out the medical cost of hospitalizations of children by injury topic. Download a PDF of the infographic for printing This is part of a series on the costs of…
Released Date:
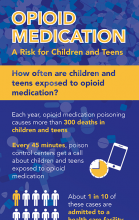
Each year, opioid medication poisoning causes more than 300 deaths in children and teens. (1) This infographic covers poison control center calls about children and teens exposed to opioid medications. Download a print version of the infographic Opioid Medication: A Risk for Children and Teens…
Released Date:
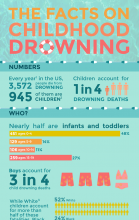
Every year in the US, 3,572 people die from drowning. Nine hundred and forty-five of them are children. Children account for one out of four drowning deaths. This infographic from the Children's Safety Network covers the demographics of drownings, locations of drownings, near drowning, and…
Released Date:
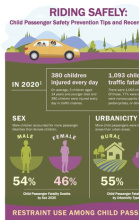
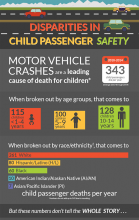
This CSN infographic focuses on the disparities in child passenger deaths and offers prevention strategies. Download a print version of the infographic Disparities in Child Passenger Safety Motor vehicle crashes are a leading cause of death among children[*] From 2010 through 2014, an average of…