
In 2015, injuries caused 13,363 deaths in U.S. children and adolescents aged 0-19. In addition, injuries were responsible for 200,225 hospitalizations* and almost 7.7 million emergency department (ED) visits in this population (Centers for Disease Control and Prevention [CDC], WISQARS, 2017). One important way to understand the burden of childhood injuries is by looking at the costs of those injuries.
*Hospitalization data do not include transferred cases reported in WISQARS
CSN’s Infographics on the Medical Costs of Injuries
The Children’s Safety Network (CSN) recently posted three infographics showing the medical costs of childhood injury fatalities, hospitalizations, and ED visits in 2015. Medical costs include emergency medical services, physician, hospital rehabilitation, prescription, and related treatment costs, such as costs for crutches, physical therapy, and coroner/medical examiner expenses in the case of deaths.
Inside each infographic, you will find:
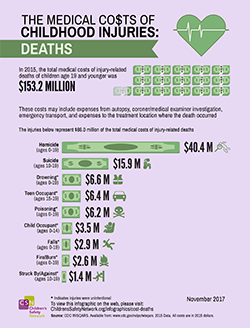
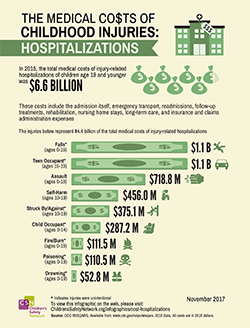
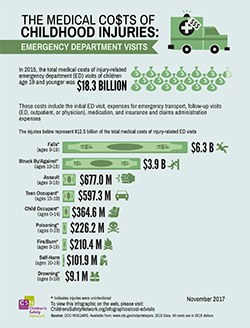
- The total medical costs of childhood injury fatalities ($153.2 million), hospitalizations ($6.6 billion), and ED visits ($18.3 billion) in the U.S. and
- A list of leading childhood injuries that result in fatalities, hospitalizations, and ED visits, along with their medical costs.
CSN’s Fact Sheet on the Medical, Work Loss, and Quality of Life Loss Costs of Injuries
 CSN also recently posted a fact sheet on the costs of leading childhood injuries. The costs include medical costs, work loss costs, and quality of life loss costs. Work loss costs include lost wages of injured persons and lost household work, or, in the case of fatality, lost earnings and household work over the victim’s expected remaining lifespan in the absence of premature death. Quality of life loss costs include the monetary value of pain, suffering, disfigurement, and lost capacity to function physically (e.g., lost sensory, mobility, and cognitive functioning, and ability to work and to perform activities of daily living). When combined, medical costs, work loss costs, and quality of life loss costs reflect the societal burden of childhood injuries.
Inside the fact sheet, you will find:
- The five-year trend from 2011 to 2015 in fatalities, hospitalizations, and ED visits for leading causes of injury
- The medical costs, work loss costs, and quality of life loss costs, as well as the combined costs, for leading causes of injury in 2015
How to Use Information on Injury Costs
Cost information can help you to:

- Raise public awareness of the burden of childhood injury
- Communicate to stakeholders and decision makers the scope of the problem of childhood injuries
- Help policy makers identify “high cost” injuries and make those injuries a priority for prevention and treatment programs
- Set injury priorities to allocate limited health resources
- Estimate the likely return on investment associated with effective prevention strategies
- Compare the effectiveness, costs, and benefits associated with injury prevention strategies
Please use the following links to access the injury costs infographics and fact sheet:
Infographics on the medical costs of childhood injuries: