CSN Publications
![]() This page displays all Children’s Safety Network (CSN) publications sorted by date released. Please feel free to download and share through Facebook, X, Pinterest, or email.
This page displays all Children’s Safety Network (CSN) publications sorted by date released. Please feel free to download and share through Facebook, X, Pinterest, or email.
Released Date:
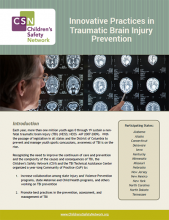
Each year, more than one million youth ages 0 through 19 sustain a non-fatal traumatic brain injury (TBI) (NEISS; NEISS –AIP 2007-2009). With the passage of legislation in all states and the District of Columbia to prevent and manage youth sports concussions, awareness of TBI is on the rise.…
Read More
Released Date:
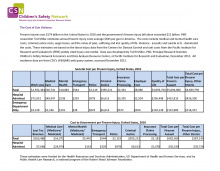
This resource was recently updated. Visit the latest version. Summarizes the incidence and cost savings of interventions to prevent injuries due to motor vehicles, impaired driving, open-flame/burns, and violence. Also includes cost savings realized by health/miscellaneous services and…
Read More
Released Date:
According to the 2013 Youth Risk Behavior Survey (YRBS), nearly 15 percent of high school students have experienced electronic bullying within the past year. Sexting has become a concern as adolescents text, e-mail, or post explicit pictures of themselves or others on social networking sites.…
Read MoreReleased Date:
The deadliest day of the year for child pedestrians is Halloween. On average, over two times as many child pedestrians die on Halloween compared to other days. Our Halloween Safety infographic has safety facts and tips to make sure you and your children have a safe and happy Halloween! Print…
Read More
Released Date:
In 2013, 560 individuals lost their lives while boating, and 2,620 sustained non-fatal injuries. Forty-nine of those who died and 589 of those who were injured were youth between the ages of 0 and 19 years old. Since 1971, boating deaths have steadily decreased thanks to programs focusing on boater…
Read More
Released Date:
CSN has produced this resource guide to provide a comprehensive, annotated list of resources for pedestrian safety. The resource guide is divided into eight sections: Data; Safe Routes to School; Pedestrian Safety for Preschoolers; Other Programs, Strategies and Campaigns; Program Planning,…
Read More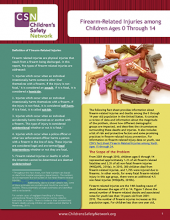
Released Date:
The following fact sheet provides information about firearm-related injuries and deaths among the 0 through 14 year old population in the United States. It contains a review of data and information about the magnitude of the problem, shows how different demographic groups…
Read More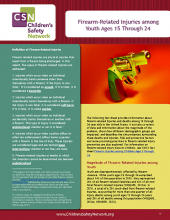
Released Date:
The following fact sheet provides information about firearm-related injuries and deaths among 15 through 24 year olds in the United States. It contains a review of data and information about the magnitude of the problem, shows how different demographic groups are impacted,…
Read More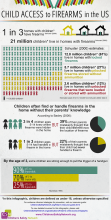
Released Date:
Children often find or handle firearms in the home without their parents' knowledge. In the United States, 2,600,000 children live in homes with unlocked firearms that are stored loaded or with ammunition. Child Access to Firearms in the US discusses the number of children who have firearms in…
Read More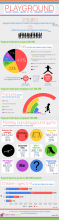
Released Date:
218,851 playground-related injuries are treated in an emergency department each year. This infographic breaks down playground-related injuries by hazard, diagnosis, equipment, and age and sex. Additional resources on playground safety can be found in the text below. Click here for the print…
Read More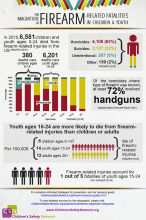
Released Date:
In 2010, 6,581 children and youth ages 0-24 died from firearm-related injuries in the US. The Magnitude of Firearm-Related Fatalities in Children and Youth breaks down the firearm-related fatalities of children and youth by age and intent. This is the second infographic in a three-part series…
Read More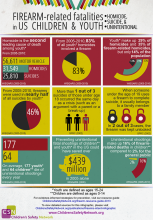
Released Date:
This infographic covers three types of firearm-related injuries and how they affect children and youth: homicide, suicide, and unintentional. This is the first in a three-part series of infographics about firearms. The other infographics in the series are available here: The Magnitude of…
Read More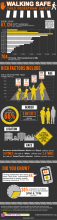
Released Date:
WALKING SAFE: Child Pedestrian Safety Every year:* 67,124 child** pedestrians are fatally or nonfatally injured(WISQARS, 2005-2010) Children ages 15-19 suffer the most pedestrian injures (WISQARS, 2005-2010) Age Group Average Fatal and Nonfatal Injuries per Year 0-4 yrs 6,456 5-9 yrs 12,…
Read More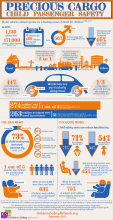
Released Date:
Though child passenger fatalities have decreased, motor vehicle-related injuries are still a leading cause of death for children. Proper use of child restraints can significantly reduce the risk of injury and death for children. Unfortunately, many child restraints are used incorrectly. This…
Read More
Released Date:
Powerful, rare earth (neodymium) magnets can cause serious injury and death when ingested. The CPSC (Consumer Product Safety Commission) has reported an estimated 1,700 ingestions of magnets that were treated in emergency departments between Jan. 1, 2009 and Dec. 31, 2011. These injuries are…
Read More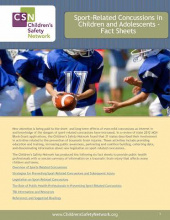
Released Date:
New attention is being paid to the short- and long-term effects of even mild concussions as interest in and knowledge of the dangers of sport-related concussions have increased. In a review of state 2012 MCH Block Grant applications, the Children’s Safety Network found that 31 states described…
Read More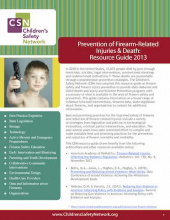
Released Date:
This resource was recently updated. Visit the latest version. The Children’s Safety Network (CSN) has compiled this resource guide on Firearm Safety and Firearm Violence Prevention to provide state Maternal and Child Health and Injury and Violence Prevention programs with a summary of what…
Read More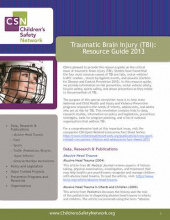
Released Date:
This resource was recently updated. Visit the latest version. CSN is pleased to provide this resource guide on the critical issue of traumatic brain injury (TBI). Studies have found that the four most common causes of TBI are falls, motor vehicle/traffic crashes, struck by/against events,…
Read More
Released Date:
Firearm injuries cost $174 billion in the United States in 2010 and the government's firearm injury bill alone exceeded $12 billion. PIRE researcher Ted Miller estimates annual firearm injury costs average $645 per gun in America. The costs include medical and mental health care costs,…
Read More