CSN Publications
![]() This page displays all Children’s Safety Network (CSN) publications sorted by date released. Please feel free to download and share through Facebook, X, Pinterest, or email.
This page displays all Children’s Safety Network (CSN) publications sorted by date released. Please feel free to download and share through Facebook, X, Pinterest, or email.
Released Date:
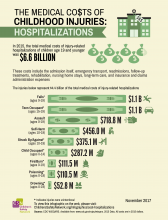
In 2015, the total medical costs of injury-related hospitalizations of children age 19 and younger was $6.6 billion. This infographic breaks out the medical cost of hospitalizations of children by injury topic. Download a PDF of the infographic for printing This is part of a series on the costs of…
Read More
Released Date:
This fact sheet covers the costs of childhood injuries, including medical costs, work loss costs, and quality of life loss costs. Work loss costs include lost wages of injured persons and lost household work, or, in the case of fatality, lost earnings and household work over the victim’s…
Read MoreReleased Date:
Each year, opioid medication poisoning causes more than 300 deaths in children and teens. (1) This infographic covers poison control center calls about children and teens exposed to opioid medications. Download a print version of the infographic Opioid Medication: A Risk for Children and Teens…
Read More
Released Date:
This resource was recently updated. Visit the latest version. Teenagers contribute to, and suffer from, the consequences of motor vehicle collisions at a disproportionate rate. Motor vehicle crashes are the leading cause of death for youth ages 15–20. According to the National Highway…
Read More
Released Date:
This publication lists evidence-based strategies and readings on child passenger safety, falls prevention, interpersonal violence prevention, suicide and self-harm prevention, and teen driver safety.
Read More
Released Date:
Suicide is the second leading cause of death for U.S. children and youth ages 10 through 24, claiming an average of 5,390 lives per year (Centers for Disease Control and Prevention, WISQARS Leading Cause of Death, Ages 10–24, 2011–2015). The CDC’s 2015 Youth Risk Behavior Survey (YRBS) found that…
Read More
Released Date:
Motor vehicle crashes are a leading cause of death among children ages one through 14 (CDC, 2016). In 2013, an average of three children were killed and 470 were injured every day in motor vehicle crashes in the U.S. (NHTSA, 2015). Child passenger safety requires consistent use of…
Read MoreReleased Date:
Every year in the US, 3,572 people die from drowning. Nine hundred and forty-five of them are children. Children account for one out of four drowning deaths. This infographic from the Children's Safety Network covers the demographics of drownings, locations of drownings, near drowning, and…
Read MoreReleased Date:
This CSN infographic focuses on the disparities in child passenger deaths and offers prevention strategies. Download a print version of the infographic Disparities in Child Passenger Safety Motor vehicle crashes are a leading cause of death among children[*] From 2010 through 2014, an average of…
Read More
Released Date:
The amount of prescription painkillers prescribed and sold in the U.S. increased nearly four times from 1999 to 2010 (CDC), yet there has not been an overall change in the amount of pain that Americans report. (Chang, H., American Journal of Emergency Medicine, 2014). Prescription and over-the-…
Read More
Released Date:
In 2012, nearly 6,000 children aged 0 through 4 were hospitalized and another 55,000 were treated and released from U.S. emergency rooms for medication poisoning (Health Care Utilization Project, National Inpatient Sample and National Emergency Department Sample, 2012). These poisonings resulted in…
Read More
Released Date:
Falls are the number one leading cause of hospitalized injury in the U.S. for children ages 0 through 14. This infographic has information on the frequency and causes of fall hospitalizations among children and youth. Download a print version of the infographic Falls are the…
Read MoreReleased Date:
In 2013, US high school students took the CDC’s Youth Risk Behavior Survey. This infographic outlines some of the findings related to bullying and fighting. Download a printable PDF of the infographic How Common Are Bullying and Fighting among High Schoolers? In 2013, US high school students…
Read More
Released Date:
This resource was recently updated. Visit the latest version. In 2013, fires and burns were the fourth leading cause of injury-related deaths to children ages 1-18 in the U.S. (WISQARS). Most of these deaths were caused by residential fires, although a working smoke detector can…
Read More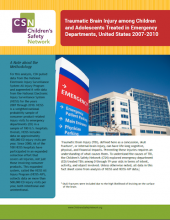
Released Date:
Traumatic Brain Injury (TBI), defined here as a concussion, skull fracture, or internal brain injury, can have life-long cognitive, physical, and financial impacts. Preventing these injuries requires an understanding of what causes them. To understand the causes of TBI, the…
Read More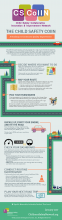
Released Date:
Child Safety CoIIN: A Roadmap to Continuous Quality Improvement The following information uses the analogy of a road trip to describe the steps for participants in the Child Safety CoIIN. We hope it will help you understand how all the different components fit together and how your state,…
Read More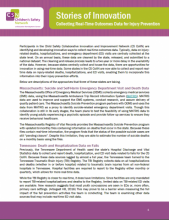
Released Date:
Participants in the Child Safety Collaborative Innovation and Improvement Network (CS CoIIN) are identifying and developing innovative ways to collect real-time outcomes data. Typically, data on injury-related deaths, hospitalizations, and emergency department (ED) visits are centrally collected at…
Read MoreReleased Date:
E-cigarettes contain a liquid nicotine solution that can be poisonous. These products come in bright colors and appealing flavors and scents, making them particularly attractive to young children. Print version of infographic with sources Poster version of infographic Lethality[1] Nicotine is an…
Read More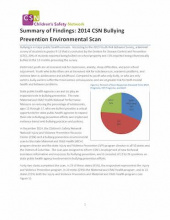
Released Date:
Bullying is a major public health concern. According to the 2013 Youth Risk Behavior Survey, a biennial survey of students in grades 9-12 that is conducted by the Centers for Disease Control and Prevention (CDC), 20% of students reported being bullied on school property and 15% reported being…
Read More
Released Date:
This resource was recently updated. Visit the latest version. In the 2013 Youth Risk Behavior Survey (YRBS), 20 percent of students reported being bullied on school property and 15 percent reported being electronically bullied in the 12 months preceding the survey. Victimized youth are at…
Read More