This infographic focuses on the homicide rates (per 100,000) of children, adolescents, and young adults ages 0 through 24 from 2014-2016. It breaks out these homicides by sex, race/ethnicity, and location.
Download a PDF of the infographic for printing
This is part of a series on injury disparities. Find the additional infographics here:
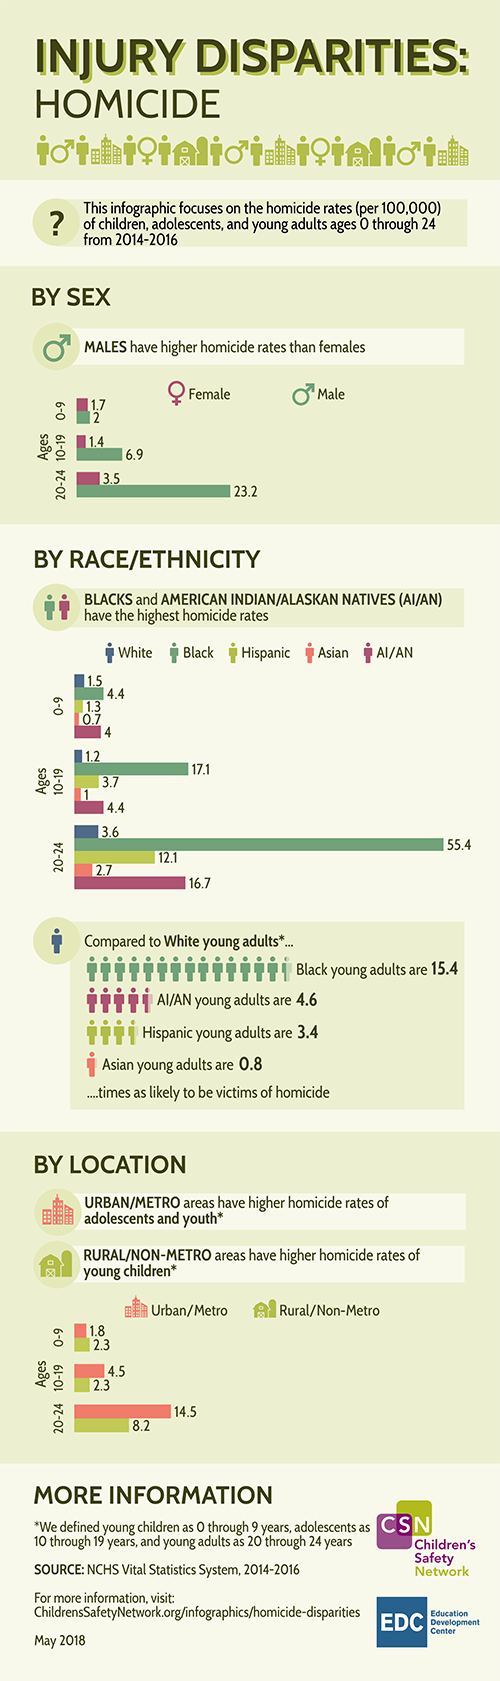
This infographic focuses on the homicide rates (per 100,000) of children, adolescents, and young adults ages 0 through 24 from 2014-2016
BY SEX
Males have higher homicide rates than females
| Table 1. Homicide Rates by Sex, Ages 0-24, 2014-2016 | |||
| Age Group | Female | Male | |
| Death Rates | 0-9 | 1.7 | 2.0 |
| 10-19 | 1.4 | 6.9 | |
| 20-24 | 3.5 | 23.2 |
BY RACE/ETHNICITY
Blacks and American Indian/Alaska Natives have the highest homicide rates
| Table 2. Homicide Rates by Race/Ethnicity, Ages 0-24, 2014-2016 | ||||||
| Age Group | White | Black | Hispanic | Asian | AI/AN | |
| Death Rates | 0-9 | 1.5 | 4.4 | 1.3 | 0.7 | 4.0 |
| 10-19 | 1.2 | 17.1 | 3.7 | 1.0 | 4.4 | |
| 20-24 | 3.6 | 55.4 | 12.1 | 2.7 | 16.7 |
Compared to White young adults*…
- Black young adults are 15.4
- AI/AN young adults are 4.6
- Hispanic young adults are 3.4
- Asian young adults are 0.8
…times as likely to be victims of homicide
BY LOCATION
Urban/metro areas have higher homicide rates of adolescents and young adults*
Rural/non-metro areas have higher homicide rates of young children*
| Table 3. Homicide Rates by Urban-Rural Status, Ages 0-24, 2014-2016 | |||
| Age Group | Urban/Metro | Rural/Non-Metro | |
| Death Rates | 0-9 | 1.8 | 2.3 |
| 10-19 | 4.5 | 2.3 | |
| 20-24 | 14.5 | 8.2 |
MORE INFORMATION
*We defined young children as 0 through 9 years, adolescents as 10 through 19 years, and young adults as 20 through 24 years
Source: NCHS Vital Statistics System, 2014-2016