This CSN infographic focuses on the disparities in child passenger deaths and offers prevention strategies.
Download a print version of the infographic
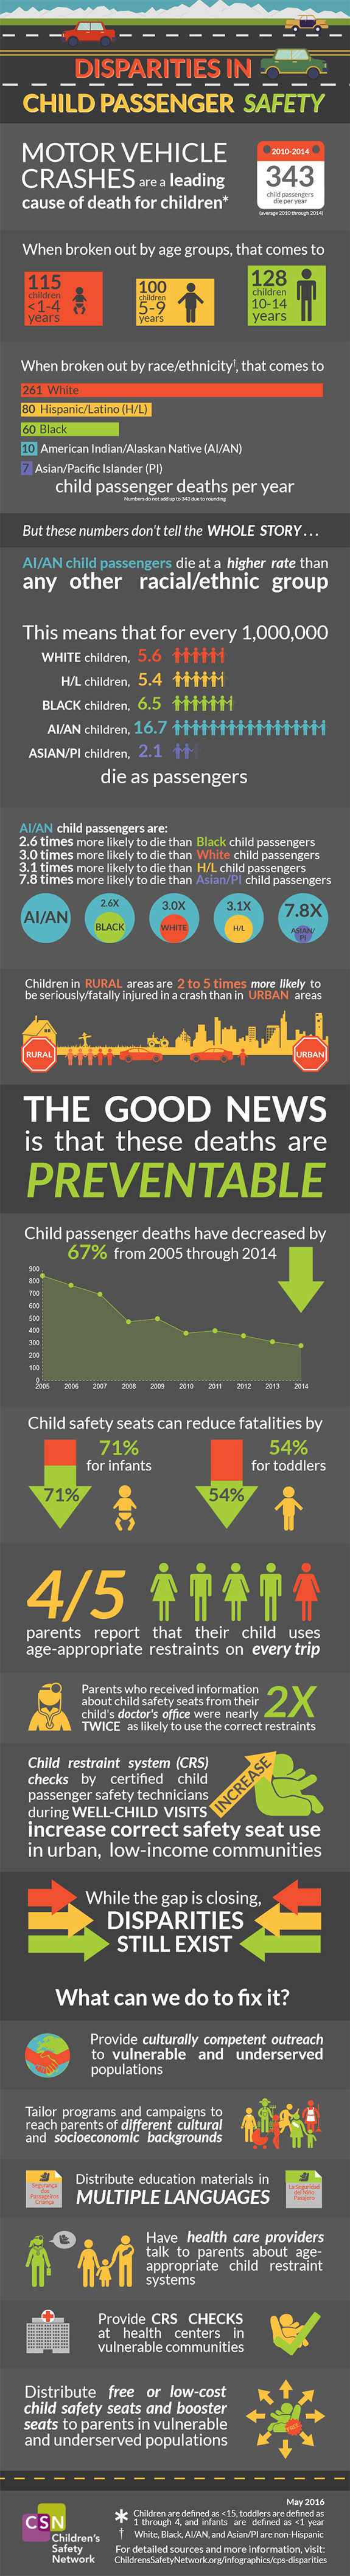
Disparities in Child Passenger Safety
Motor vehicle crashes are a leading cause of death among children[*]
From 2010 through 2014, an average of 343 child passengers died per year
When broken out by age, that comes to:
- 115 children <1 through 4 years old
- 100 children 5 through 9 years old
- 128 children 10 through 14 years old
When broken out by race/ethnicity[†], that comes to:
- 261 White
- 80 Hispanic/Latino (H/L)
- 60 Black
- 10 American Indian/Alaskan Native (AI/AN)
- 7 Asian/Pacific Islander (PI)
child passenger deaths per year
But these numbers don’t tell the whole story…
AI/AN child passengers die at a higher rate than any other racial/ethnic group
This means that for every 1,000,000
- White children, 5.6
- H/L children, 5.4
- Black children, 6.5
- AI/AN children, 16.7
- Asian/PI children, 2.1
die as passengers
AI/AN child passengers are:
- 2.6 times more likely to die than Black child passengers
- 3.0 times more likely to die than White child passengers
- 3.1 times more likely to die than H/L child passengers
- 7.8 times more likely to die than Asian/PI child passengers (WISQARS)
Children in rural areas are 2 to 5 times more likely to be seriously or fatally injured in a crash than in urban areas (Huseth, 2013)
The good news is that these deaths are preventable
Child passenger deaths have decreased by 67% from 2005 through 2014 (WISQARS)
| Year | Deaths |
| 2005 | 842 |
| 2006 | 763 |
| 2007 | 694 |
| 2008 | 470 |
| 2009 | 495 |
| 2010 | 376 |
| 2011 | 396 |
| 2012 | 356 |
| 2013 | 309 |
| 2014 | 277 |
Child safety seats can reduce fatalities by 71% for infants and 54% for toddlers (NHTSA, 2013)
4 out of 5 parents report that their child used the age-appropriate restraint on every trip (Macy, 2014)
Parents who received information about child safety seats from their child’s doctor’s office were nearly twice as likely to use the correct restraints (Macy, 2014)
Child restraint system (CRS) checks by certified child passenger safety technicians during well-child visits increase correct safety seat use in urban, low-income communities (Quinlan, 2007)
While the gap is closing, disparities still exist
What can we do to fix it?
Provide culturally competent outreach to vulnerable and underserved populations
Tailor programs and campaigns to reach parents of different cultural and socioeconomic backgrounds
Distribute education materials in multiple languages
Have health care providers talk to parents about age-appropriate child restraint systems
Provide CRS checks at health centers in vulnerable communities
Distribute free or low-cost child safety seats and booster seats to parents/caregivers in vulnerable and underserved populations
Sources
WISQARS. Fatal Injury Data. WISQARS (p. Accessed March 15, 2016 by R. Willmer). Atlanta, GA. Retrieved from http://www.cdc.gov/injury/wisqars/fatal.html
National Highway Traffic Safety Administration (NHTSA). (2013). 2011 Children Traffic Safety Fact Sheet. Retrieved from http://www-nrd.nhtsa.dot.gov/Pubs/811767.pdf
Huseth, Andrea. (2013). Misinformation Contributing to Safety Issues in Vehicle Restraints for Children: A Rural/Urban Comparison, MPC-13-264. North Dakota State University - Upper Great Plains Transportation Institute, Fargo: Mountain-Plains Consortium. Retrieved from: http://www.mountain-plains.org/pubs/pdf/MPC13-264.pdf
Macy, M. L., Cunningham, R. M., Resnicow, K., & Freed, G. L. (2014). Disparities in age-appropriate child passenger restraint use among children aged 1 to 12 years. Pediatrics, 133(2), 262–71. http://doi.org/10.1542/peds.2013-1908
Quinlan, K. P., Holden, J., & Kresnow, M.J. (2007). Providing car seat checks with well-child visits at an urban health center: a pilot study. Injury Prevention: Journal of the International Society for Child and Adolescent Injury Prevention, 13, 352–354. http://doi.org/10.1136/ip.2006.015099
To view this infographic on the web, visit: https://www.childrenssafetynetwork.org/infographics/disparities-child-passenger-safety