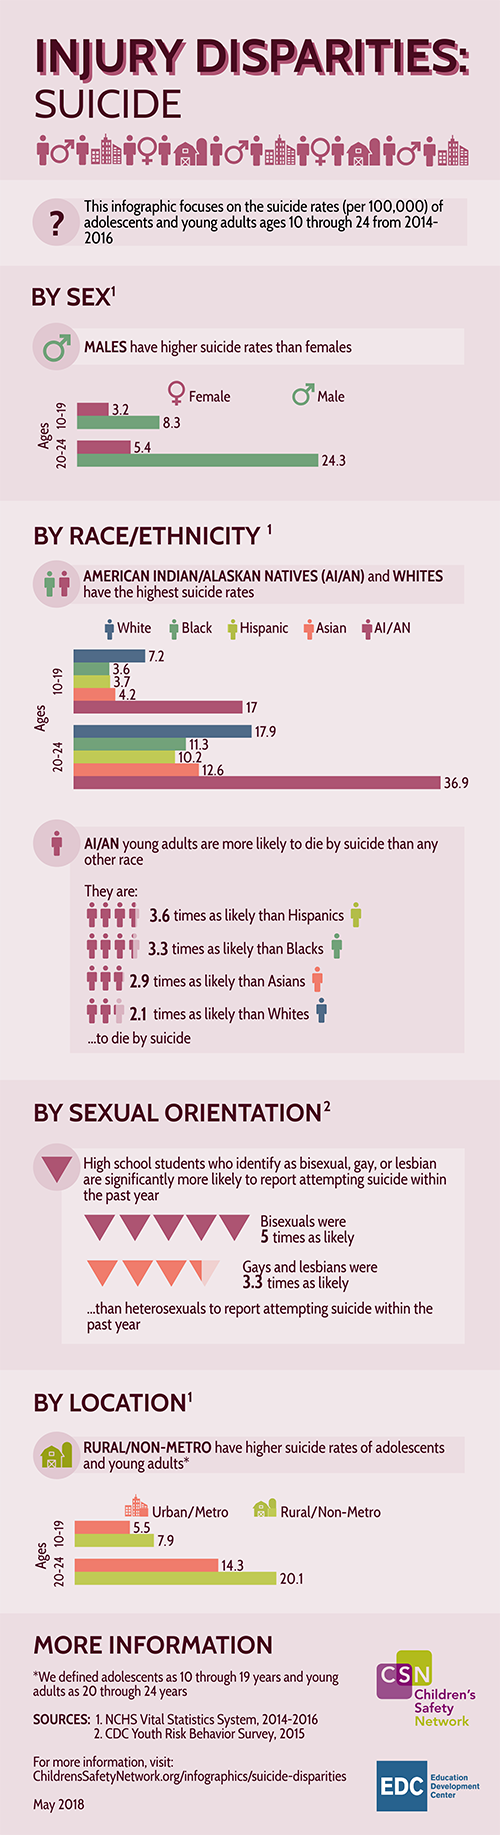
This infographic focuses on the suicide rates (per 100,000) of adolescents and young adults ages 10 through 24 from 2014-2016. It breaks out these deaths by sex, race/ethnicity, sexual orientation, and location.
Download a PDF of the infographic for printing
This is part of a series on injury disparities. Find the additional infographics here:
This infographic focuses on the suicide rates (per 100,000) of adolescents and young adults ages 10 through 24 from 2014-2016
BY SEX1
Males have higher suicide rates than females
| Table 1. Suicide Rates by Sex, Ages 10-24, 2014-2016 | |||
| Age Group | Female | Male | |
| Death Rates | 10-19 | 3.2 | 8.3 |
| 20-24 | 5.4 | 24.3 |
BY RACE/ETHNICITY1
American Indian/Alaska Natives (AI/AN) and Whites have the highest suicide rates
| Table 2. Suicide Rates by Race/Ethnicity, Ages 10-24, 2014-2016 | ||||||
| Age Group | White | Black | Hispanic | Asian | AI/AN | |
| Death Rates | 10-19 | 7.2 | 3.6 | 3.7 | 4.2 | 17.0 |
| 20-24 | 17.9 | 11.3 | 10.2 | 12.6 | 36.9 |
AI/AN young adults are more likely to die by suicide than any other race. They are:
- 3.6 times as likely than Hispanics
- 3.3 times as likely than Blacks
- 2.9 times as likely than Asians
- 2.1 times as likely than Whites
…to die by suicide
BY SEXUAL ORIENTATION2
High school students who identify as bisexual, gay, or lesbian are significantly more likely to report attempting suicide within the past year
- Bisexuals were 5 times as likely
- Gays and lesbians were 3.3 times as likely
…than heterosexuals to report attempting suicide within the past year
BY LOCATION1
Rural/non-metro have higher suicide rates of adolescents and young adults*
| Table 3. Suicide Rates by Urban-Rural Status, Ages 10-24, 2014-2016 | |||
| Age Group | Urban/Metro | Rural/Non-Metro | |
| Death Rates | 10-19 | 5.5 | 7.9 |
| 20-24 | 14.3 | 20.1 |
MORE INFORMATION
*We defined adolescents as 10 through 19 years and young adults as 20 through 24 years
Sources: 1. NCHS Vital Statistics System, 2014-2016
2. CDC Youth Risk Behavior Survey, 2015