CSN Publications
![]() This page displays all Children’s Safety Network (CSN) publications sorted by date released. Please feel free to download and share through Facebook, X, Pinterest, or email.
This page displays all Children’s Safety Network (CSN) publications sorted by date released. Please feel free to download and share through Facebook, X, Pinterest, or email.
Released Date:
Injuries and violence are leading causes of morbidity and mortality among U.S. children and adolescents. These injuries are preventable. Researchers have identified many strategies that are effective in preventing injuries in this population. This paper synthesizes findings from recent systematic…
Read More
Released Date:
The U.S. Department of Health and Human Services defines bullying as repetitive aggressive behavior that is repeated over time and involves an imbalance of power or strength (Centers for Disease Control and Prevention [CDC], 2017a). Bullying behaviors may include teasing, name calling, mockery…
Read More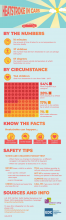
Released Date:
Heatstroke happens quickly and can be deadly. This infographic goes over the numbers on heatstroke in cars, the circumstances of deaths, clears up common misconceptions about heatstroke, and provides safety tips. Download a PDF of the infographic for printing BY THE NUMBERS 10 minutes: the amount…
Read More
Released Date:
Change Packages The Change Packages list the evidence-based and evidence-informed strategies that will lead to breakthrough improvement in key topic areas of child safety. The change packages are available as comprehensive resources organized across the entire socio-ecological model, and also…
Read More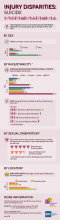
Released Date:
This infographic focuses on the suicide rates (per 100,000) of adolescents and young adults ages 10 through 24 from 2014-2016. It breaks out these deaths by sex, race/ethnicity, sexual orientation, and location. Download a PDF of the infographic for printing This is part of a series on injury…
Read More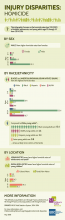
Released Date:
This infographic focuses on the homicide rates (per 100,000) of children, adolescents, and young adults ages 0 through 24 from 2014-2016. It breaks out these homicides by sex, race/ethnicity, and location. Download a PDF of the infographic for printing This is part of a series on injury…
Read More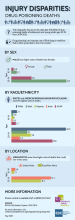
Released Date:
This infographic focuses on the rates (per 100,000) of drug poisoning deaths of adolescents and young adults ages 10-24 from 2014-2016. It breaks out these deaths by sex, race/ethnicity, and location. Drug poisoning is defined as an improper use of illicit drugs or medicine that is either…
Read More
Released Date:
The injury and violence prevention systems toolkit is a compilation of resources aimed at state and jurisdiction public health practitioners and organizational leaders and managers committed to reducing injuries and violence through systems thinking and quality improvement. The toolkit is organized…
Read More
Released Date:
Teen dating abuse is physical, sexual, or emotional abuse (including stalking) that occurs between teens and pre-teens in a relationship. It can take place in person or online, and can involve a current or past partner (CDC, 2016). Teen dating abuse is quite common, affecting around one in…
Read More
Released Date:
Health disparities are preventable differences in the burden of injury or of opportunities to achieve optimal health that are experienced by socially disadvantaged populations (Centers for Disease Control and Prevention [CDC], 2008). Health disparities are often related to the historical and…
Read More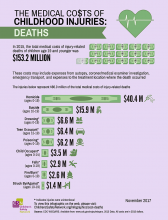
Released Date:
In 2015, the total medical costs of injury-related deaths of children age 19 and younger was $153.2 million. This infographic breaks out the medical cost of child deaths by injury topic. Download a PDF of the infographic for printing This is part of a series on the costs of childhood injuries…
Read More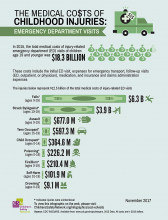
Released Date:
In 2015, the total medical costs of injury-related emergency department (ED) visits of children age 19 and younger was $18.3 billion. This infographic breaks out the medical cost of emergency department visits of children by injury topic. Download a PDF of the infographic for printing This is part…
Read More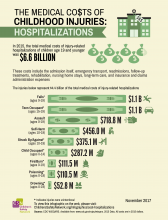
Released Date:
In 2015, the total medical costs of injury-related hospitalizations of children age 19 and younger was $6.6 billion. This infographic breaks out the medical cost of hospitalizations of children by injury topic. Download a PDF of the infographic for printing This is part of a series on the costs of…
Read More
Released Date:
This fact sheet covers the costs of childhood injuries, including medical costs, work loss costs, and quality of life loss costs. Work loss costs include lost wages of injured persons and lost household work, or, in the case of fatality, lost earnings and household work over the victim’s…
Read MoreReleased Date:
Each year, opioid medication poisoning causes more than 300 deaths in children and teens. (1) This infographic covers poison control center calls about children and teens exposed to opioid medications. Download a print version of the infographic Opioid Medication: A Risk for Children and Teens…
Read More
Released Date:
This resource was recently updated. Visit the latest version. Teenagers contribute to, and suffer from, the consequences of motor vehicle collisions at a disproportionate rate. Motor vehicle crashes are the leading cause of death for youth ages 15–20. According to the National Highway…
Read More
Released Date:
This publication lists evidence-based strategies and readings on child passenger safety, falls prevention, interpersonal violence prevention, suicide and self-harm prevention, and teen driver safety.
Read More
Released Date:
Suicide is the second leading cause of death for U.S. children and youth ages 10 through 24, claiming an average of 5,390 lives per year (Centers for Disease Control and Prevention, WISQARS Leading Cause of Death, Ages 10–24, 2011–2015). The CDC’s 2015 Youth Risk Behavior Survey (YRBS) found that…
Read More
Released Date:
Motor vehicle crashes are a leading cause of death among children ages one through 14 (CDC, 2016). In 2013, an average of three children were killed and 470 were injured every day in motor vehicle crashes in the U.S. (NHTSA, 2015). Child passenger safety requires consistent use of…
Read More